Author Box


Discuss Your Project

About Us

We are Microsoft Gold partner with its presence across the United States and India. We are a dynamic and professional IT services provider that serves enterprises and startups, helping them meet the challenges of the global economy. We offer services in the area of CRM Consultation and implementation, Application development, Mobile application development, Web development & Offshore Development.

Example of Sales Report

Examples of Sales Reports: From Daily to Advanced

By Abhishek Singh / February 3, 2023

February 3, 2023
Examples of Sales Reports: From Daily to Advanced

Multiple small business owners are still unsure of why they are not closely monitoring and improving the performance of their teams to improve sales. That is undoubtedly what separates a successful business from one that is having trouble. You must make sure that your business's plans are implemented well in addition to making sure they are fantastic in the first place.

Making manual monthly reports can be difficult for certain firms. For improved data visualization, they undertake manual accounting, input the data into templates, and then manually build graphs and pie charts. However, visualizing every spreadsheet can be extremely time-consuming and annoying.    

An analysis tool that offers perceptions of the effectiveness of various sales efforts inside a business is a sales report. One of the most effective strategies to boost team performance is to use daily and/or weekly sales reports with your team.

Sales teams use these reports, together with powerful KPIs, to identify patterns and insights that will help them enhance the quality of their goods and services. You can enhance your sales process, fill knowledge gaps, and consistently meet your quotas by using sales reports.

As a sales manager, you can acquire concrete information for your team members or the C-suite to quickly make decisions.     

To assess the circumstances, choose the best course of action, and make decisions, they provide a snapshot of the business's exercise at a certain time. By utilizing current internet sales report technologies, these daily salesperson reports help in identifying new market opportunities.     

What is a Sales Report?    

A report that details a business's sales operations is known as a sales report or a sales analysis report.

This report typically includes information on sales volume, leads, new accounts, income, and costs for the specified period. The performance of your sales team can be assessed using this data at each level of the sales funnel.      

Your sales teams and the business's overall goals can be more effectively aligned with the help of sales reports. More accountability and openness among your sales representatives encourage a spirit of cooperation and teamwork, with more precise goal setting and forecasting of sales revenue.     

Organizations can use a variety of sales reports to follow developments, evaluate successes, pinpoint potential areas for improvement, and gather crucial information that can inform their future planning at different phases of the selling cycle. Sales reports can furthermore help businesses find new market opportunities and boost productivity.     

Also, read: Using Salesforce Pipeline Reports to Track Your Sales Performance

What are the goals of the Sales Reports, and why are they crucial to your Business?    

The sales statistics from these reports are crucial to the success of your business, even though writing them down probably is not the most thrilling activity in the world of sales.

They can identify your most important salespeople and show readers how well specific reps are doing. Also, they provide information on the leads' qualifications and their source.     

Sales reports can be used to track your progress toward your goals, identify problems with your sales pipeline, and assess how your business is expanding.     

You can determine which marketing tactics are effective using monthly sales reports, and you can use their findings to adjust your sales operations.     

The purpose of sales reports is to show you where you are now and about where you want to be. And they provide you with the knowledge you need to accomplish your objectives.     

Sales reports help in bringing and achieving your sales teams and business objectives:     

  • More accountability and transparency from your sales representatives. 
  • Encourage a culture of cooperation and teamwork. 
  • Goal setting and more precise sales revenue predictions. 

"Pro-tip: Using big data analytics to create good sales reports is a good idea if you manage a lot of data."  

Also, read: Strategies To Improve Salesforce Lead Conversion Rates

Sales Report Types   

Businesses use a variety of reporting approaches to track the performance of their sales activities and guarantee success everywhere, depending on the analysis goal, the business type, and other factors.

Certain sales report formats concentrate on different sales KPIs, requirements, or tactics.

There are also several variants of reports that will concentrate on various areas, such as the general development of the sales, a breakdown of the income earned, the evolution of the sales volume, a comparison to the pre-set sales objective, CLV (Customer Lifetime Value), etc.

Some reports concentrate on the performance of the sales representative themselves throughout the entire sales cycle, from generating leads to closing deals.     

They can take many different forms. For example, a daily sales report format will monitor sales KPIs that are pertinent daily, such as the number of calls or meetings a salesperson sets up or the leads generated.

Weekly sales report templates frequently track the quantity of business the team closes as well as the amount of money made.

A more comprehensive view of each sales representative's or the team's activity can be obtained from a monthly sales report format.

By combining everything on sales dashboards, you can automate your data and concentrate on more human-centric tasks without having to perform time-consuming manual computations or repetitive exports.  

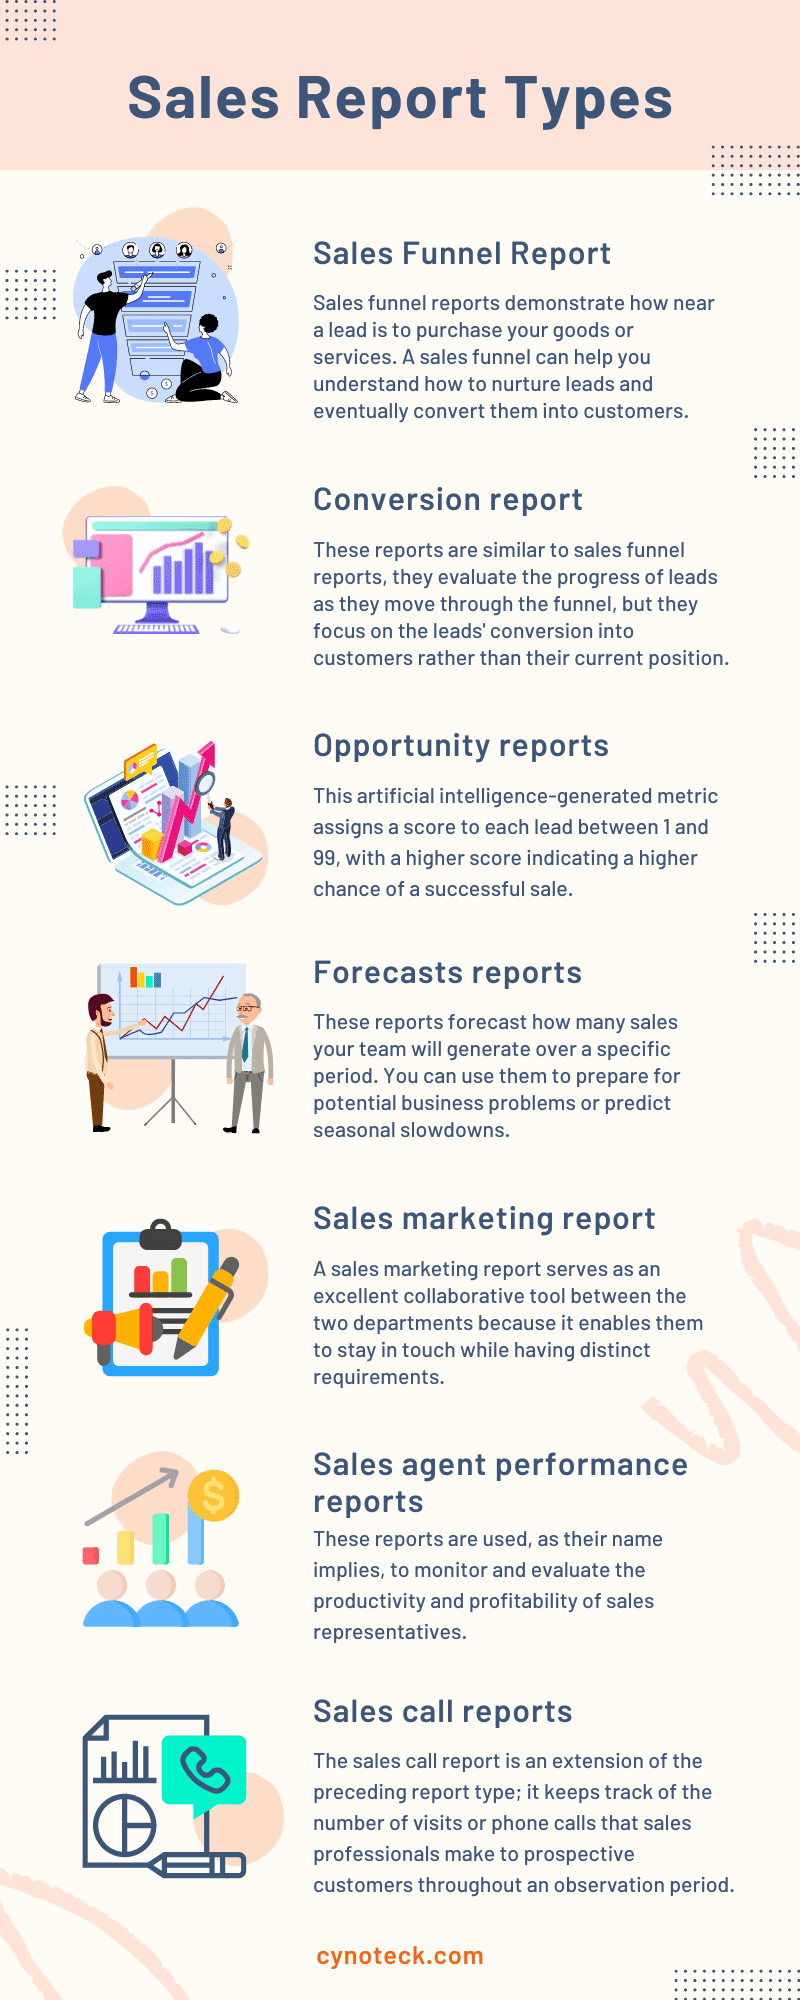
Here are some of the report types to help you recognize the numerous sales activity: 
[embedimage]

1) Sales Funnel Report  

Sales funnel reports demonstrate how near a lead is to purchase your goods or services. A sales funnel can help you understand how to nurture leads and eventually convert them into customers.

You can find flaws in your sales pipeline by comparing back-to-back sales funnel reports. These reports are used by companies to show the customer's journey from the time they first contact them to the time they make a purchase.

This makes it possible for management to assess how well sales representatives individually perform in advancing prospects through the sales funnel as well as examine the entire process and address any bottlenecks that may be preventing leads from becoming paying clients.  

2) Conversion report  

These reports are similar to sales funnel reports, they evaluate the progress of leads as they move through the funnel, but they focus on the leads' conversion into customers rather than their current position.

The conversion report keeps track of all information about the procedure of turning leads into new clients. To understand how the distinct phases are going, how many leads are converted, and how many are lost, data from your sales funnel is required.

These reports can be generated on a monthly, quarterly, or annual basis and work as an excellent tool for identifying areas for improvement.  

Also, read: 10 Best CRM for Real Estate Agents to Improve Their Productivity and Sales

3) Opportunity reports  

The Einstein opportunity score serves as the foundation for opportunity score reports.

This artificial intelligence-generated metric assigns a score to each lead between 1 and 99, with a higher score indicating a higher chance of a successful sale.

Higher-scoring applicants are more likely to become paying clients than lower-scoring applicants.

Businesses divide their leads according to this score and concentrate more of their financial and human resources on the leads with the highest conversion rates.

These reports can be used to schedule how your team will divide their lead-pursuit time.  

4) Forecasts reports  

These reports forecast how many sales your team will generate over a specific period. You can use them to prepare for potential business problems or predict seasonal slowdowns.

The department can forecast how many sales will be made at a specific point in the future with this simple yet intricate report type.

These reports enable businesses to identify any potential seasonal slowdowns and any other obstacles that require immediate attention. A forecast report can also point out pipeline flaws so that they can be properly improved.     

5) Sales marketing report  

A sales marketing report serves as an excellent collaborative tool between the two departments because it enables them to stay in touch while having distinct requirements.

This simple report format analyses the advancements of all marketing-related tactics that seek to boost sales.

For example, the marketing team can monitor which campaign the sales team has found to be most effective and make sure the same level of content is being created.      

6) Sales agent performance reports  

These reports are used, as their name implies, to monitor and evaluate the productivity and profitability of sales representatives.

Your team can examine these reports to spot potential opportunities for upselling and cross-selling in the future or to mark goods and services as being particularly well suited for these types of sales strategies.

These reports frequently track metrics such as the number of leads produced, the number of chances closed, and revenue produced, among others.  

7) Sales call reports  

The sales call report is an extension of the preceding report type; it keeps track of the number of visits or phone calls that sales professionals make to prospective customers throughout an observation period.

These sales reports deal with calls made to leads, prospects, and clients to convince them to make purchases.

You can learn more about the abilities of your leads and the performance of your salespeople through these reports. Depending on the goal of the analysis, the time can be weekly, monthly, or yearly.     

"Key Takeaway: There are several types of sales reports that track different KPIs and run at different intervals. Choose the right format, consider your audience, the information, and the time, then finally finish with written insights and context."  

Also, read: How Can CRM Software Help You Align Sales and Marketing?

Examples of Sales Report: Daily, Weekly, Monthly, and Quarterly

Examples of Monthly Sales Reports 

Every month, sales trends should be tracked, assessed, and evaluated with the help of monthly sales reports. It contains longer-term measurements of KPIs including monthly progress reports, conversion reports, and sales cycle length, among many more. Examples of monthly sales reports that can be useful are listed below.    

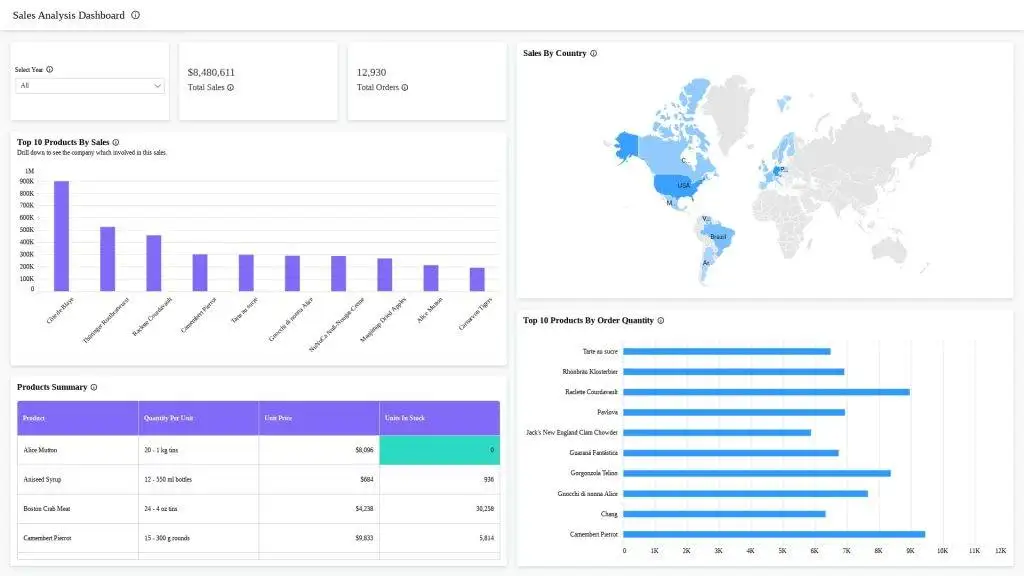
1) Report on Sales Analysis  

Businesses can derive useful insights into the evolution of their strategies and pinpoint areas where they could be improved by looking at important revenue, profit, and product data for different regions.    
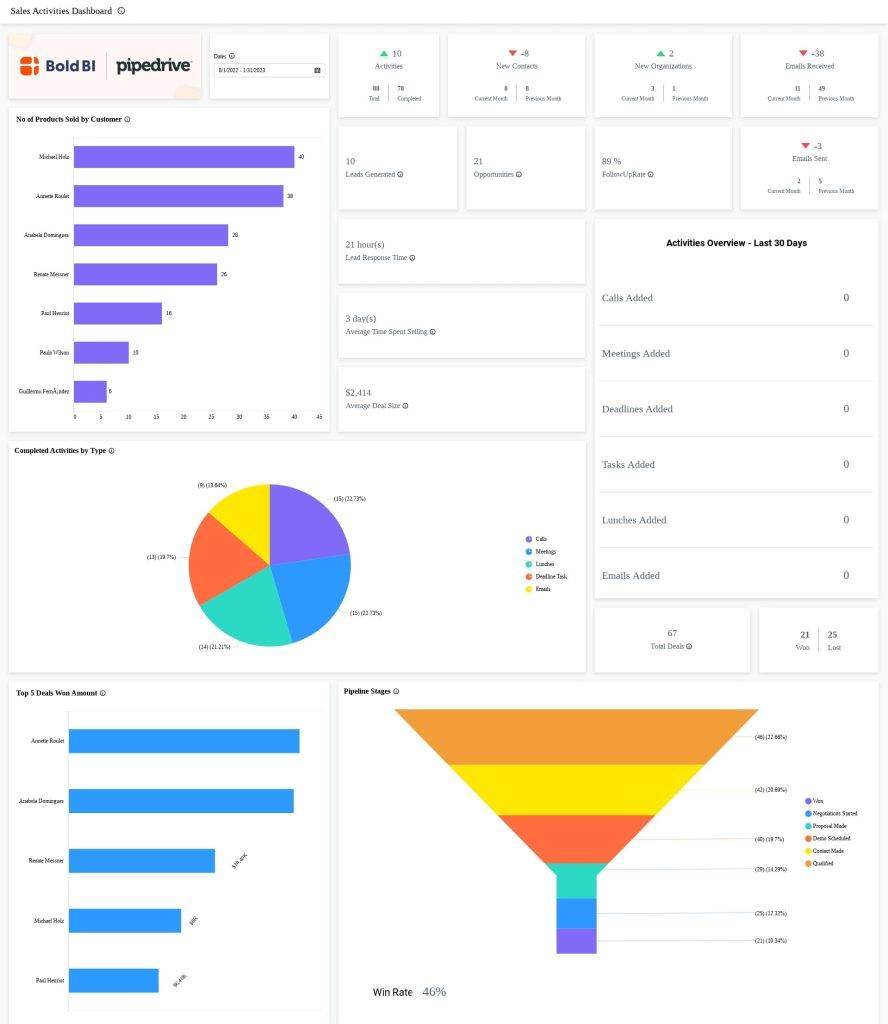
2) Report on sales and orders  

Keeping track of everything that is sent out, but mostly returned, can be challenging at times when there are so many orders to manage.

In that case, this is yet another template for a monthly report that can be useful for online merchants. The information in this report can be the key to quickly identifying the source of the issue and solving it.    
3) Report on sales conversion  

Are you able to observe how well your reps perform once they have completed each phase of the funnel to convert the leads into closed deals?

This report can be useful because it analyses each step of the sales funnel, allowing you to spot potential problems early on and improve your conversion rates.    
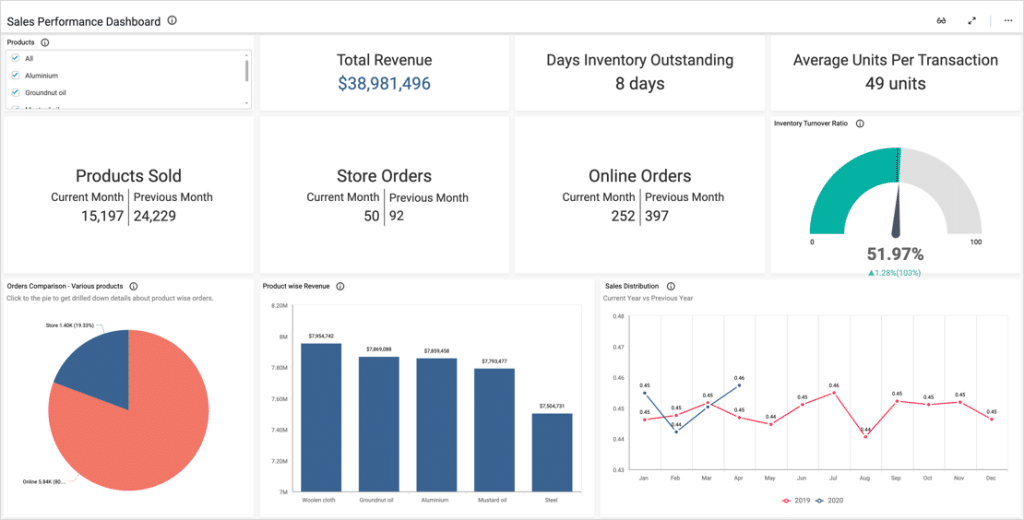
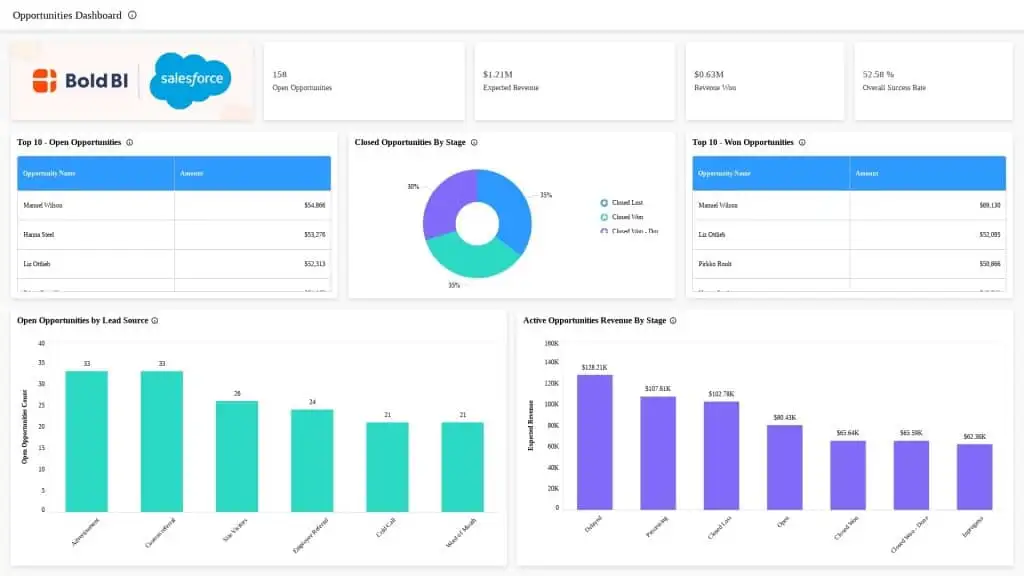
4) Report on sales opportunities  

The management, development, monitoring, and analysis of opportunities are all included in a sales manager report.

Opportunities are available in a single, central location with the help of BI reporting tools, and you can view the data in real time with the help of automatic data updates.    
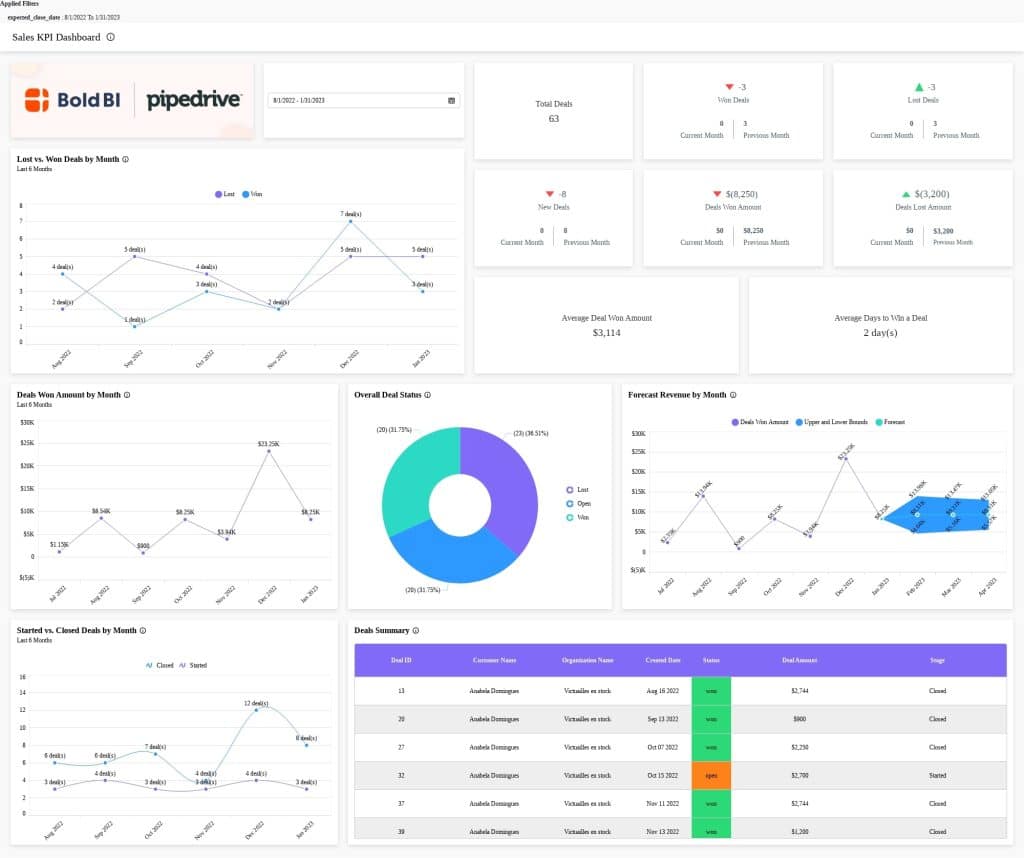
5) KPI report for sales  

These metrics must be closely monitored each month since they have the power to alter the direction of a business's sales strategy.

The most crucial operational and strategic data can be monitored by sales VPs, managers, and executives to improve the caliber and performance of assigned sales targets.    
6) Outbound call statistics report 

Cold calling over the phone is still one of the most crucial sales tactics. Therefore, it is crucial to give this report, which highlights several crucial aspects of your outbound procedures and outcomes.

This allows you to contrast your results with those from the prior time and determine when it is best to make calls to maximize outcomes and revenues.   

Also, read: Salesforce for Small Business: How it can be helpful

Examples of Weekly Sales Reports

A weekly sales report works as a measurement tool used by businesses and people to monitor sales performance and crucial KPIs, like lead-to-opportunity ratio, lead conversion ratio, sales volume by channel, total sales per region, and more.

Now, we will look at reports and KPIs you can monitor weekly from a B2B and retail perspective.    

1) The total volume of sales by channel  

The total sales volume can make it simple to see where you should focus your sales efforts so that you can make the necessary adjustments.

This report demonstrates which geographic regions and client acquisition strategies provide the greatest income.    

2) Report for revenue closed by rep.  

With this report, you can monitor trends by rep over two to three weeks, which is useful for shorter sales cycles. However long your sales cycle is, you should still conduct this report.

This report offers some insight into when your salespeople typically close deals during longer sales cycles, which will improve the accuracy of your estimates for the future.    

3) The score for the sales opportunity  

This report will help you to develop an efficient weekly strategy and action plan for where your sales representatives should concentrate their efforts.

In this manner, you can more wisely organize your resources and devote more time to possibilities with greater promise.    

4) Customer lifetime value report  

This report details the anticipated revenue per client, and you can check it each week to see if the average is increasing or falling.

It is one of the most crucial KPIs you can monitor in a B2B sales environment, starting every week and then extending over months.    

5) Report to measure rates of cross- and up-selling

When you compare each rep's results, you can see how they all rated and instruct others to use the same strategies.

This weekly sales report sample is helpful to monitor because daily reporting is simply too brief a period to assess your strengths and weaknesses.

Your sales will increase in this way, and there is a good probability that you will also increase customer loyalty and satisfaction.    

6) The ratio of leads to opportunities report   

You can assess the proportion of qualified versus unqualified leads by tracking this indicator every week. The lead-to-opportunity ratio tells you how many leads you need to generate to meet your revenue goals.

Once you have a baseline ratio, you can determine how many leads you need to generate to accomplish your target growth while also having predictable revenue.    

7) The ratio of opportunities to wins by rep  

This report presents a simple sales KPI that demonstrates how successful each of your reps is at closing opportunities.

At the very least once a week, if a rep is not closing deals as quickly as his or her colleagues, it might just be an irregularity. However, if the tendency in these weekly reports persists, now might be the time to support this rep.    

8) Lead-to-sales ratio  

One of the most crucial ratios for a sales team is this one since it provides a starting point for figuring out how many leads the team will require to achieve its goals.

According to its name, this report will keep track of the number of prospects that "win," or convert into paying clients.    

Also, read: What is Salesforce Service Cloud? All you need to know

Top examples of Daily Sales Reports

You should not put too much emphasis on outcome-dependent metrics in daily reporting. The most pertinent day-to-day sales data, such as the number of closed deals, client discussions, prospects created, and many other sales related KPIs, can be extracted from a daily sales report by businesses, sales reps, and managers.

The examples of B2B daily reports that you can use to manage your business's operations and retail KPIs are provided below.    

1) The overall daily sales volume   

Tracking daily volumes is crucial, particularly in the retail sector, as they can show you which days of the week perform best and how to take advantage of this. This daily report is clear and specific, it focuses on the volume of sales made each day.    

2) Report on average transaction size  

This KPI differs based on the sort of retail outlet. Since you can infer a lot about customer behaviors merely by looking at the device or payment type, another retail KPI is quite helpful to measure.

This KPI helps you determine how to modify your advertising and online store to suit the requirements of your clients.   

3) Report for order totals and average units sold to each customer  

This report illustrates the typical number of units per customer and assesses how many products are bought by customers.

It can establish the general direction of purchasing patterns and provide you with enough information to assess your sales even more carefully.

To prevent out-of-retail analytics, you can use this to enhance your retail analytics and determine which weekdays are the most occupied ones.    

4) Number of customer interactions by a rep  

This report details how many phone calls and face-to-face meetings each representative has per day. A representative who spends more time conversing with clients will produce greater outcomes for your business than a representative who does not.    

5) Number of meetings a representative schedule  

Your daily KPI is of little use if it measures something that does not advance your overarching objective. Overall, it is difficult to schedule too many sales meetings, which is why this template for a daily sales activity report is helpful.    

6) Lead rep response time  

This daily sales report form can be challenging and tricky at times because it varies widely depending on the lead kind and situation.

This report makes it easier for you to monitor the daily performance and averages of your sales representatives. You can then assess the consequences of your overall approach more accurately.  

7) Report measuring the number of opportunities for sales  

Sales must compare the number of opportunities against the volume of purchases as well as valid qualifying leads, both of which are crucial.

You can see in this sales analysis report the potential purchase worth of fresh opportunities, and it makes sense to keep track of both their development and daily progress.    

8) Number of new leads generated by the representative and volume of sales/closed deals  

This report is simple to understand. You can specify lead qualifying requirements and base your report on those figures if you are concerned that sales reps would use low-quality leads to increase their numbers.

This is crucial for small businesses because they often carry products with low added value and must close as many sales as they can to turn a profit.  

Also, read: Salesforce Lead Management Features and key stages

Advantages of sales reports  

Standardized data reporting is essential to your business's success. The following are some typical advantages of making sales reports.  

1) Better and Quick Decision-Making  

Making timely, well-informed judgments is critical to the accomplishment of any sales strategy. Your management can quickly refine what fuels the business's growth with routine sales reports.

You can also monitor and enhance underperforming sales strategies.  

2) Team and rep performance improvement  

Sales reports offer data-driven insights into the team's overall and individual reps' sales performance. You can also determine who might gain from routine one-on-one sessions to advance their careers and reach their quotas.

Sales reports can be used to identify areas where your sales process needs to be improved if your team is not meeting the business's revenue targets.     

3) Improving Your Sales Team's Morale  

Each team member's sales performance is tracked and shown, which inspires them to work harder. Sales reports can boost team morale to new heights, whether you produce them daily, weekly, or monthly.

Your sales team can be motivated to strive for the "best" results by sales reporting's ability to facilitate healthy competition.        

Also, read: Salesforce Artificial Intelligence for Marketing, Sales, and Service

Concluding Thoughts  

The act of reporting is now a must-have requirement for teams. These sales reports will enable you to quickly begin arranging your data. Understanding the goal of the dashboard or report you are working on will therefore make it much easier to select the ideal sales dashboard template.

You can obtain a fairly accurate picture of trends when the most crucial KPIs are in use, which will help you in making the best sales and marketing decisions. The first step in building successful dashboards that can improve your decision-making and advance your organization is understanding where to start with reporting.     

Here is a list of things you can discover in a sales report:     

  • A summary of the business's sales operations and activity.   
  • To evaluate stated action, specific sales KPIs are monitored and assessed.  
  • A predetermined time for analyzing the KPIs.  
  • Graphs and charts to display the gathered data.  
  • A top-management executive sales summary.  

It is worth mentioning that creating a sales report is the most crucial step in analyzing your business performance. With a CRM like Salesforce, it is easy to create visual reports within minutes and forecast your business strength in the long run.        

FAQs (Frequently Asked Questions) 

1) What is the sales report's structure?  

An average sales report includes key performance metrics like firm performance, products sold, and profits. Metrics like new opportunities, regional sales, team performance, sales growth, or other pertinent information can also be valuable to consider.  

2) What is the purpose of a monthly sales report?  

Sales are tracked, assessed, analyzed, and trends are identified in a monthly sales report. It measures longer-term KPIs such as month-end performance, conversion report, and sales cycle length.  

3) What is an example of a monthly report?  

A sample monthly report is required in every business. We, at Cynoteck, keep track of every month to make sure that multiple projects and responsibilities are successful, responsible, and open. An executive report is created by combining reports from different months.  


[sc name="Salesforce Automation"] [add_newsletter] [add_related_page_diff_contents blog_cat = "salesforce"]

Multiple small business owners are still unsure of why they are not closely monitoring and improving the performance of their teams to improve sales. That is undoubtedly what separates a successful business from one that is having trouble. You must make sure that your business’s plans are implemented well in addition to making sure they are fantastic in the first place.

Making manual monthly reports can be difficult for certain firms. For improved data visualization, they undertake manual accounting, input the data into templates, and then manually build graphs and pie charts. However, visualizing every spreadsheet can be extremely time-consuming and annoying.    

An analysis tool that offers perceptions of the effectiveness of various sales efforts inside a business is a sales report. One of the most effective strategies to boost team performance is to use daily and/or weekly sales reports with your team.

Sales teams use these reports, together with powerful KPIs, to identify patterns and insights that will help them enhance the quality of their goods and services. You can enhance your sales process, fill knowledge gaps, and consistently meet your quotas by using sales reports.

As a sales manager, you can acquire concrete information for your team members or the C-suite to quickly make decisions.     

To assess the circumstances, choose the best course of action, and make decisions, they provide a snapshot of the business’s exercise at a certain time. By utilizing current internet sales report technologies, these daily salesperson reports help in identifying new market opportunities.     

What is a Sales Report?    

A report that details a business’s sales operations is known as a sales report or a sales analysis report.

This report typically includes information on sales volume, leads, new accounts, income, and costs for the specified period. The performance of your sales team can be assessed using this data at each level of the sales funnel.      

Your sales teams and the business’s overall goals can be more effectively aligned with the help of sales reports. More accountability and openness among your sales representatives encourage a spirit of cooperation and teamwork, with more precise goal setting and forecasting of sales revenue.     

Organizations can use a variety of sales reports to follow developments, evaluate successes, pinpoint potential areas for improvement, and gather crucial information that can inform their future planning at different phases of the selling cycle. Sales reports can furthermore help businesses find new market opportunities and boost productivity.     

Also, read: Using Salesforce Pipeline Reports to Track Your Sales Performance

What are the goals of the Sales Reports, and why are they crucial to your Business?    

The sales statistics from these reports are crucial to the success of your business, even though writing them down probably is not the most thrilling activity in the world of sales.

They can identify your most important salespeople and show readers how well specific reps are doing. Also, they provide information on the leads’ qualifications and their source.     

Sales reports can be used to track your progress toward your goals, identify problems with your sales pipeline, and assess how your business is expanding.     

You can determine which marketing tactics are effective using monthly sales reports, and you can use their findings to adjust your sales operations.     

The purpose of sales reports is to show you where you are now and about where you want to be. And they provide you with the knowledge you need to accomplish your objectives.     

Sales reports help in bringing and achieving your sales teams and business objectives:     

  • More accountability and transparency from your sales representatives. 
  • Encourage a culture of cooperation and teamwork. 
  • Goal setting and more precise sales revenue predictions. 

“Pro-tip: Using big data analytics to create good sales reports is a good idea if you manage a lot of data.”  

Also, read: Strategies To Improve Salesforce Lead Conversion Rates

Sales Report Types   

Businesses use a variety of reporting approaches to track the performance of their sales activities and guarantee success everywhere, depending on the analysis goal, the business type, and other factors.

Certain sales report formats concentrate on different sales KPIs, requirements, or tactics.

There are also several variants of reports that will concentrate on various areas, such as the general development of the sales, a breakdown of the income earned, the evolution of the sales volume, a comparison to the pre-set sales objective, CLV (Customer Lifetime Value), etc.

Some reports concentrate on the performance of the sales representative themselves throughout the entire sales cycle, from generating leads to closing deals.     

They can take many different forms. For example, a daily sales report format will monitor sales KPIs that are pertinent daily, such as the number of calls or meetings a salesperson sets up or the leads generated.

Weekly sales report templates frequently track the quantity of business the team closes as well as the amount of money made.

A more comprehensive view of each sales representative’s or the team’s activity can be obtained from a monthly sales report format.

By combining everything on sales dashboards, you can automate your data and concentrate on more human-centric tasks without having to perform time-consuming manual computations or repetitive exports.  

Here are some of the report types to help you recognize the numerous sales activity: 

Copy Infographic
×

1) Sales Funnel Report  

Sales funnel reports demonstrate how near a lead is to purchase your goods or services. A sales funnel can help you understand how to nurture leads and eventually convert them into customers.

You can find flaws in your sales pipeline by comparing back-to-back sales funnel reports. These reports are used by companies to show the customer’s journey from the time they first contact them to the time they make a purchase.

This makes it possible for management to assess how well sales representatives individually perform in advancing prospects through the sales funnel as well as examine the entire process and address any bottlenecks that may be preventing leads from becoming paying clients.  

2) Conversion report  

These reports are similar to sales funnel reports, they evaluate the progress of leads as they move through the funnel, but they focus on the leadsconversion into customers rather than their current position.

The conversion report keeps track of all information about the procedure of turning leads into new clients. To understand how the distinct phases are going, how many leads are converted, and how many are lost, data from your sales funnel is required.

These reports can be generated on a monthly, quarterly, or annual basis and work as an excellent tool for identifying areas for improvement.  

Also, read: 10 Best CRM for Real Estate Agents to Improve Their Productivity and Sales

3) Opportunity reports  

The Einstein opportunity score serves as the foundation for opportunity score reports.

This artificial intelligence-generated metric assigns a score to each lead between 1 and 99, with a higher score indicating a higher chance of a successful sale.

Higher-scoring applicants are more likely to become paying clients than lower-scoring applicants.

Businesses divide their leads according to this score and concentrate more of their financial and human resources on the leads with the highest conversion rates.

These reports can be used to schedule how your team will divide their lead-pursuit time.  

4) Forecasts reports  

These reports forecast how many sales your team will generate over a specific period. You can use them to prepare for potential business problems or predict seasonal slowdowns.

The department can forecast how many sales will be made at a specific point in the future with this simple yet intricate report type.

These reports enable businesses to identify any potential seasonal slowdowns and any other obstacles that require immediate attention. A forecast report can also point out pipeline flaws so that they can be properly improved.     

5) Sales marketing report  

A sales marketing report serves as an excellent collaborative tool between the two departments because it enables them to stay in touch while having distinct requirements.

This simple report format analyses the advancements of all marketing-related tactics that seek to boost sales.

For example, the marketing team can monitor which campaign the sales team has found to be most effective and make sure the same level of content is being created.      

6) Sales agent performance reports  

These reports are used, as their name implies, to monitor and evaluate the productivity and profitability of sales representatives.

Your team can examine these reports to spot potential opportunities for upselling and cross-selling in the future or to mark goods and services as being particularly well suited for these types of sales strategies.

These reports frequently track metrics such as the number of leads produced, the number of chances closed, and revenue produced, among others.  

7) Sales call reports  

The sales call report is an extension of the preceding report type; it keeps track of the number of visits or phone calls that sales professionals make to prospective customers throughout an observation period.

These sales reports deal with calls made to leads, prospects, and clients to convince them to make purchases.

You can learn more about the abilities of your leads and the performance of your salespeople through these reports. Depending on the goal of the analysis, the time can be weekly, monthly, or yearly.     

“Key Takeaway: There are several types of sales reports that track different KPIs and run at different intervals. Choose the right format, consider your audience, the information, and the time, then finally finish with written insights and context.”  

Also, read: How Can CRM Software Help You Align Sales and Marketing?

Examples of Sales Report: Daily, Weekly, Monthly, and Quarterly

Examples of Monthly Sales Reports 

Every month, sales trends should be tracked, assessed, and evaluated with the help of monthly sales reports. It contains longer-term measurements of KPIs including monthly progress reports, conversion reports, and sales cycle length, among many more. Examples of monthly sales reports that can be useful are listed below.    

1) Report on Sales Analysis  

Businesses can derive useful insights into the evolution of their strategies and pinpoint areas where they could be improved by looking at important revenue, profit, and product data for different regions.    

2) Report on sales and orders  

Keeping track of everything that is sent out, but mostly returned, can be challenging at times when there are so many orders to manage.

In that case, this is yet another template for a monthly report that can be useful for online merchants. The information in this report can be the key to quickly identifying the source of the issue and solving it.    

3) Report on sales conversion  

Are you able to observe how well your reps perform once they have completed each phase of the funnel to convert the leads into closed deals?

This report can be useful because it analyses each step of the sales funnel, allowing you to spot potential problems early on and improve your conversion rates.    

4) Report on sales opportunities  

The management, development, monitoring, and analysis of opportunities are all included in a sales manager report.

Opportunities are available in a single, central location with the help of BI reporting tools, and you can view the data in real time with the help of automatic data updates.    

5) KPI report for sales  

These metrics must be closely monitored each month since they have the power to alter the direction of a business’s sales strategy.

The most crucial operational and strategic data can be monitored by sales VPs, managers, and executives to improve the caliber and performance of assigned sales targets.    

6) Outbound call statistics report 

Cold calling over the phone is still one of the most crucial sales tactics. Therefore, it is crucial to give this report, which highlights several crucial aspects of your outbound procedures and outcomes.

This allows you to contrast your results with those from the prior time and determine when it is best to make calls to maximize outcomes and revenues.   

Also, read: Salesforce for Small Business: How it can be helpful

Examples of Weekly Sales Reports

A weekly sales report works as a measurement tool used by businesses and people to monitor sales performance and crucial KPIs, like lead-to-opportunity ratio, lead conversion ratio, sales volume by channel, total sales per region, and more.

Now, we will look at reports and KPIs you can monitor weekly from a B2B and retail perspective.    

1) The total volume of sales by channel  

The total sales volume can make it simple to see where you should focus your sales efforts so that you can make the necessary adjustments.

This report demonstrates which geographic regions and client acquisition strategies provide the greatest income.    

2) Report for revenue closed by rep.  

With this report, you can monitor trends by rep over two to three weeks, which is useful for shorter sales cycles. However long your sales cycle is, you should still conduct this report.

This report offers some insight into when your salespeople typically close deals during longer sales cycles, which will improve the accuracy of your estimates for the future.    

3) The score for the sales opportunity  

This report will help you to develop an efficient weekly strategy and action plan for where your sales representatives should concentrate their efforts.

In this manner, you can more wisely organize your resources and devote more time to possibilities with greater promise.    

4) Customer lifetime value report  

This report details the anticipated revenue per client, and you can check it each week to see if the average is increasing or falling.

It is one of the most crucial KPIs you can monitor in a B2B sales environment, starting every week and then extending over months.    

5) Report to measure rates of cross- and up-selling

When you compare each rep’s results, you can see how they all rated and instruct others to use the same strategies.

This weekly sales report sample is helpful to monitor because daily reporting is simply too brief a period to assess your strengths and weaknesses.

Your sales will increase in this way, and there is a good probability that you will also increase customer loyalty and satisfaction.    

6) The ratio of leads to opportunities report   

You can assess the proportion of qualified versus unqualified leads by tracking this indicator every week. The lead-to-opportunity ratio tells you how many leads you need to generate to meet your revenue goals.

Once you have a baseline ratio, you can determine how many leads you need to generate to accomplish your target growth while also having predictable revenue.    

7) The ratio of opportunities to wins by rep  

This report presents a simple sales KPI that demonstrates how successful each of your reps is at closing opportunities.

At the very least once a week, if a rep is not closing deals as quickly as his or her colleagues, it might just be an irregularity. However, if the tendency in these weekly reports persists, now might be the time to support this rep.    

8) Lead-to-sales ratio  

One of the most crucial ratios for a sales team is this one since it provides a starting point for figuring out how many leads the team will require to achieve its goals.

According to its name, this report will keep track of the number of prospects that “win,” or convert into paying clients.    

Also, read: What is Salesforce Service Cloud? All you need to know

Top examples of Daily Sales Reports

You should not put too much emphasis on outcome-dependent metrics in daily reporting. The most pertinent day-to-day sales data, such as the number of closed deals, client discussions, prospects created, and many other sales related KPIs, can be extracted from a daily sales report by businesses, sales reps, and managers.

The examples of B2B daily reports that you can use to manage your business’s operations and retail KPIs are provided below.    

1) The overall daily sales volume   

Tracking daily volumes is crucial, particularly in the retail sector, as they can show you which days of the week perform best and how to take advantage of this. This daily report is clear and specific, it focuses on the volume of sales made each day.    

2) Report on average transaction size  

This KPI differs based on the sort of retail outlet. Since you can infer a lot about customer behaviors merely by looking at the device or payment type, another retail KPI is quite helpful to measure.

This KPI helps you determine how to modify your advertising and online store to suit the requirements of your clients.   

3) Report for order totals and average units sold to each customer  

This report illustrates the typical number of units per customer and assesses how many products are bought by customers.

It can establish the general direction of purchasing patterns and provide you with enough information to assess your sales even more carefully.

To prevent out-of-retail analytics, you can use this to enhance your retail analytics and determine which weekdays are the most occupied ones.    

4) Number of customer interactions by a rep  

This report details how many phone calls and face-to-face meetings each representative has per day. A representative who spends more time conversing with clients will produce greater outcomes for your business than a representative who does not.    

5) Number of meetings a representative schedule  

Your daily KPI is of little use if it measures something that does not advance your overarching objective. Overall, it is difficult to schedule too many sales meetings, which is why this template for a daily sales activity report is helpful.    

6) Lead rep response time  

This daily sales report form can be challenging and tricky at times because it varies widely depending on the lead kind and situation.

This report makes it easier for you to monitor the daily performance and averages of your sales representatives. You can then assess the consequences of your overall approach more accurately.  

7) Report measuring the number of opportunities for sales  

Sales must compare the number of opportunities against the volume of purchases as well as valid qualifying leads, both of which are crucial.

You can see in this sales analysis report the potential purchase worth of fresh opportunities, and it makes sense to keep track of both their development and daily progress.    

8) Number of new leads generated by the representative and volume of sales/closed deals  

This report is simple to understand. You can specify lead qualifying requirements and base your report on those figures if you are concerned that sales reps would use low-quality leads to increase their numbers.

This is crucial for small businesses because they often carry products with low added value and must close as many sales as they can to turn a profit.  

Also, read: Salesforce Lead Management Features and key stages

Advantages of sales reports  

Standardized data reporting is essential to your business’s success. The following are some typical advantages of making sales reports.  

1) Better and Quick Decision-Making  

Making timely, well-informed judgments is critical to the accomplishment of any sales strategy. Your management can quickly refine what fuels the business’s growth with routine sales reports.

You can also monitor and enhance underperforming sales strategies.  

2) Team and rep performance improvement  

Sales reports offer data-driven insights into the team’s overall and individual reps’ sales performance. You can also determine who might gain from routine one-on-one sessions to advance their careers and reach their quotas.

Sales reports can be used to identify areas where your sales process needs to be improved if your team is not meeting the business’s revenue targets.     

3) Improving Your Sales Team’s Morale  

Each team member’s sales performance is tracked and shown, which inspires them to work harder. Sales reports can boost team morale to new heights, whether you produce them daily, weekly, or monthly.

Your sales team can be motivated to strive for the “best” results by sales reporting’s ability to facilitate healthy competition.        

Also, read: Salesforce Artificial Intelligence for Marketing, Sales, and Service

Concluding Thoughts  

The act of reporting is now a must-have requirement for teams. These sales reports will enable you to quickly begin arranging your data. Understanding the goal of the dashboard or report you are working on will therefore make it much easier to select the ideal sales dashboard template.

You can obtain a fairly accurate picture of trends when the most crucial KPIs are in use, which will help you in making the best sales and marketing decisions. The first step in building successful dashboards that can improve your decision-making and advance your organization is understanding where to start with reporting.     

Here is a list of things you can discover in a sales report:     

  • A summary of the business’s sales operations and activity.   
  • To evaluate stated action, specific sales KPIs are monitored and assessed.  
  • A predetermined time for analyzing the KPIs.  
  • Graphs and charts to display the gathered data.  
  • A top-management executive sales summary.  

It is worth mentioning that creating a sales report is the most crucial step in analyzing your business performance. With a CRM like Salesforce, it is easy to create visual reports within minutes and forecast your business strength in the long run.        

FAQs (Frequently Asked Questions) 

1) What is the sales report’s structure?  

An average sales report includes key performance metrics like firm performance, products sold, and profits. Metrics like new opportunities, regional sales, team performance, sales growth, or other pertinent information can also be valuable to consider.  

2) What is the purpose of a monthly sales report?  

Sales are tracked, assessed, analyzed, and trends are identified in a monthly sales report. It measures longer-term KPIs such as month-end performance, conversion report, and sales cycle length.  

3) What is an example of a monthly report?  

A sample monthly report is required in every business. We, at Cynoteck, keep track of every month to make sure that multiple projects and responsibilities are successful, responsible, and open. An executive report is created by combining reports from different months.  


Salesforce Consulting Services

If you are new to automation and confused about Workflow or Process Builder. Need not to worry, we have got you all covered. Talk to our experts and clear all the cloudy thoughts about automation.


guest
0 Comments
Inline Feedbacks
View all comments
0
Would love your thoughts, please comment.x
()
x
× How can I help you?