SQL Server Reporting Services (SSRS) is a reporting tool that allows you to produce well-defined reports with matrices and tables in the form of data, graphs, images, and charts. A server is available to host these reports and we can execute this server anytime using the parameter defined by the users.
Reporting Service Types:
1) Microsoft SQL Server Integration services which integrate data from different sources.
2) Microsoft SQL Server Analytical service which helps for the analysis of the data
3) Microsoft SQL Server Reporting service permits for creating a graphical report of the data.
Business Intelligence (SSDT-BI)
- Business Intelligence is a technique for transforming data into meaningful and useful information for business analysis purposes, which helps to make a quick decision.
- Microsoft offers some tools to transform your business data into information. You can utilize these tools with the interface of the visual studio.
- SQL Server Data Tool – Business Intelligence (SSDT-BI) substitutes BIDS for Visual Studio 2010, 2012, 2013, and 2015. It serves the identical purpose as BIDS, offering a development environment for creating business solutions.
How to Install SSRS?
You can set up the SSDT tool during the installation of visual studio or can download it separately if you do not set up this during the installation.
- Download SSDT for Visual Studio 2015 (17.4)
- Open the ISO image.
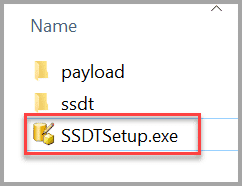
- Run the SSDTSetup.exe file.
Also, read: Microsoft Ignite November 2021 – New Power Platform announcements and capabilities
How SSRS Works?
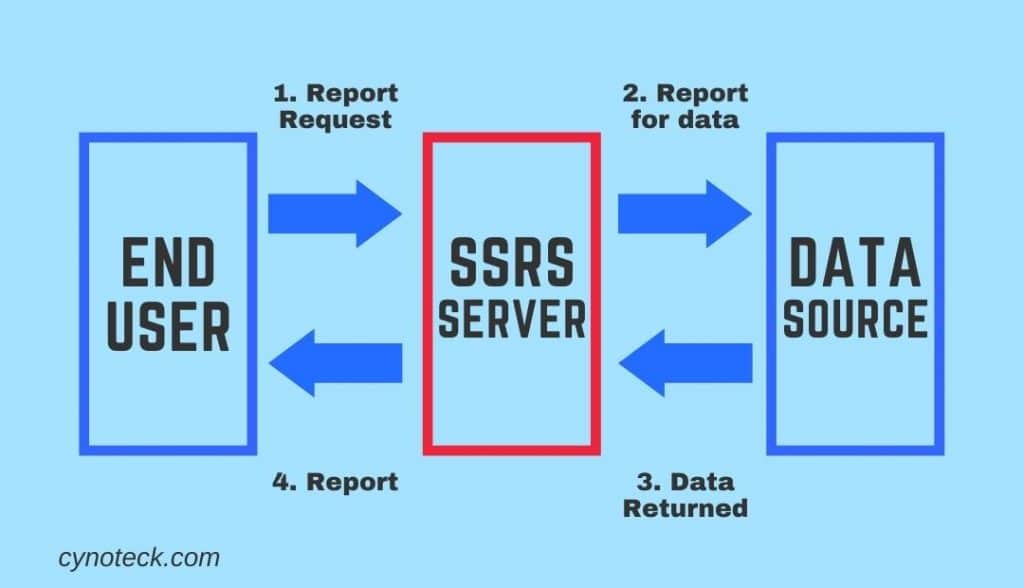
1) The report users are the peoples who work with the data as well as want some insights from data. They send a request to the SSRS server.
2) SSRS server finds the metadata of the report and sends a request for data to the data sources.
3) Data returned by the data source is merged with the report definition into a report.
4) When the report is developed, it is returned to the client.
Report Components:
- Dataset: To add data to a report, you build datasets. Each dataset defines the result set from executing a query command on a data source.
- Data Sources: Data Source contains the connection properties of a report.
- Parameters: Parameters can be utilized for everything from criteria in a query to filters for a Tablix to controlling the visibility of objects on a report.
Also, read: Business Central Integration with LeafLink Cannabis CRM
Types of SQL Server Reporting Services (SSRS):
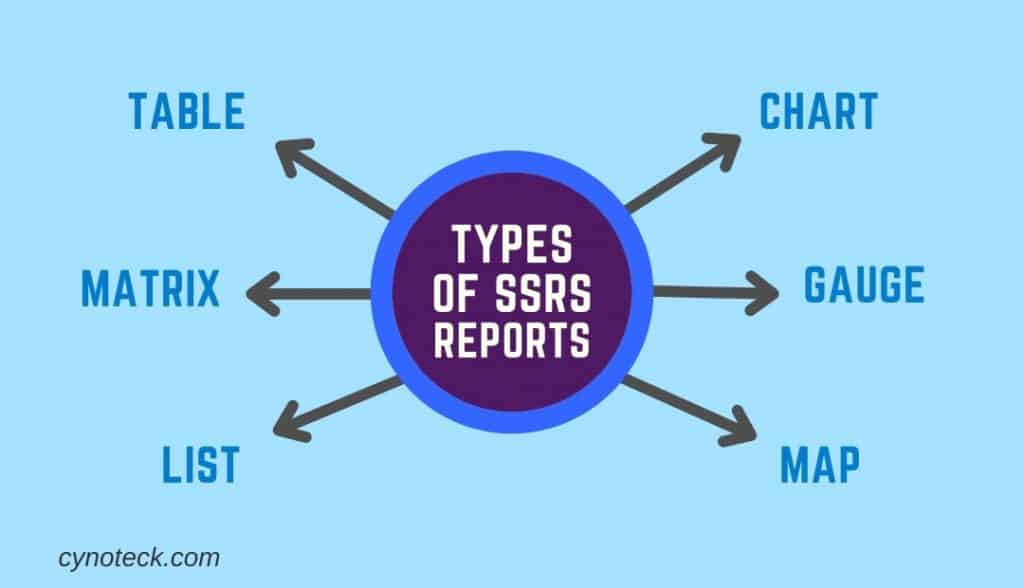
- Table – A table is defined as a data region that shows data row by row. It has static columns: when you design your report, you determine the number of columns. The table has dynamic rows: they expand downwards to accommodate the data.
- Matrix – A matrix is also called a crosstab. A matrix data region includes both dynamic rows and columns: they expand to adjust the data. A matrix can have static rows and columns, and dynamic rows and columns.
- List – A list is a data region that displays data arranged in a freeform style. You can set report items to build a form with text boxes, images, and other data regions positioned anywhere within the list.
- Chart – A chart shows data graphically. Examples of charts incorporate pie, bar, and line charts, but there are many more styles that are supported.
- Gauge – A gauge shows data as a range with an indicator indicating a specific value within the range.
- Map – A map allows you to present data against a geographical background. Map data can be an ESRI shapefile, spatial data from a SQL Server query, or Microsoft Bing map tiles.
Also, read: 5 Easy steps for sales return in Business Central
How to Create a Tabular Report Using Fetch XML
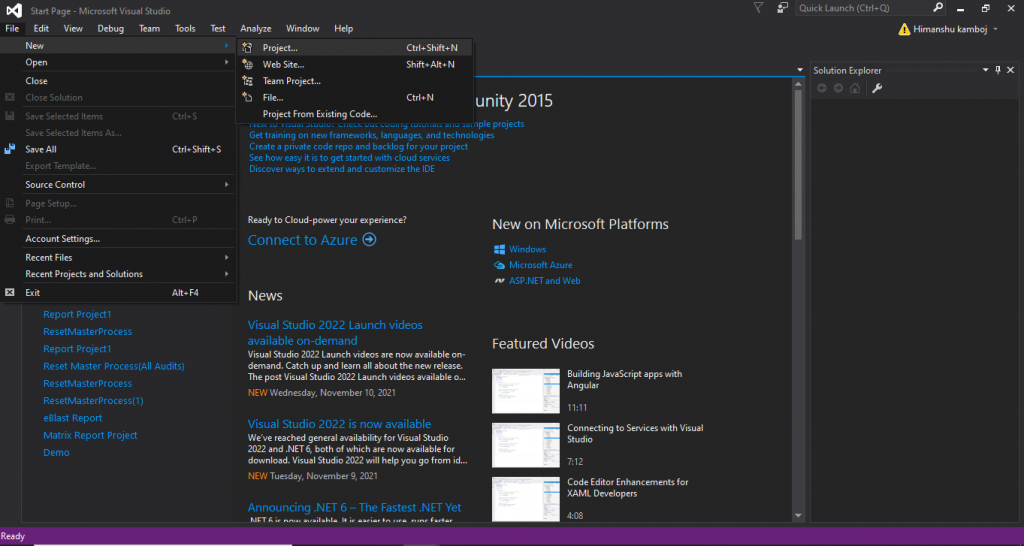
- After successfully installation of SSDT tools and authoring extension of CRM dynamics open the visual studio and click to new file-> new project.
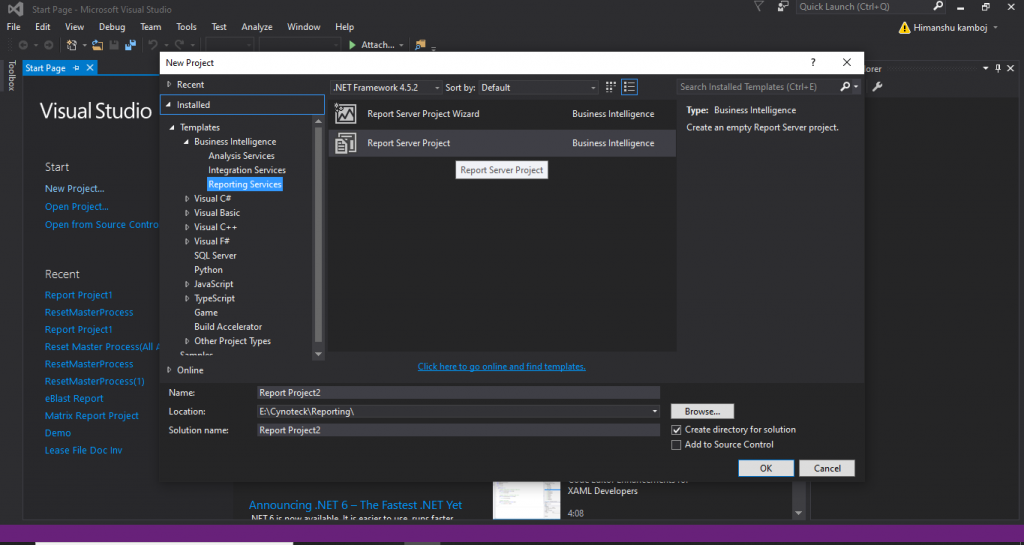
- Click on the Reporting services under the Business Intelligence Section and select the Report Server Project Wizard. You can select the location by clicking on the browse option, to which location you want to save the reporting project.
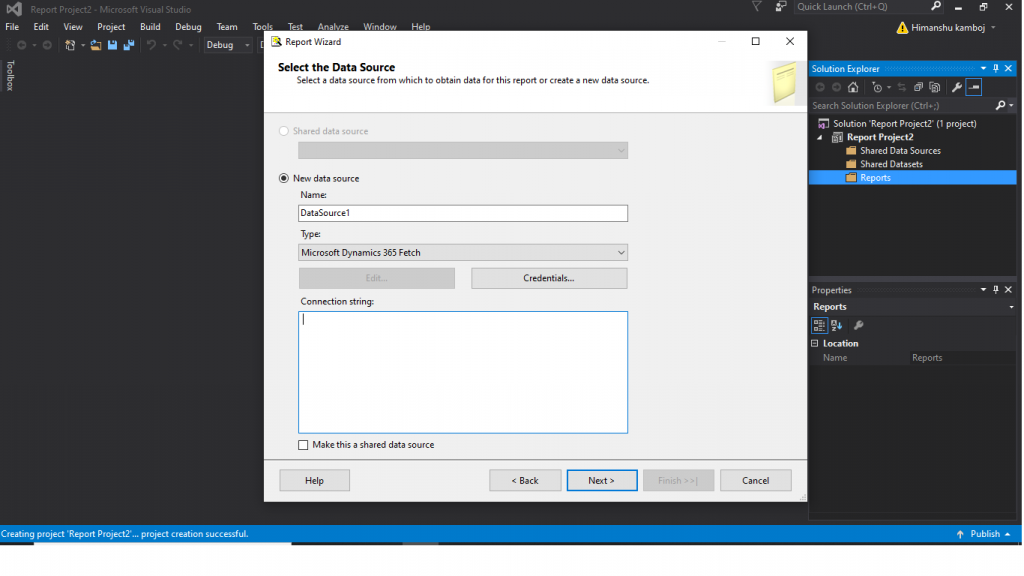
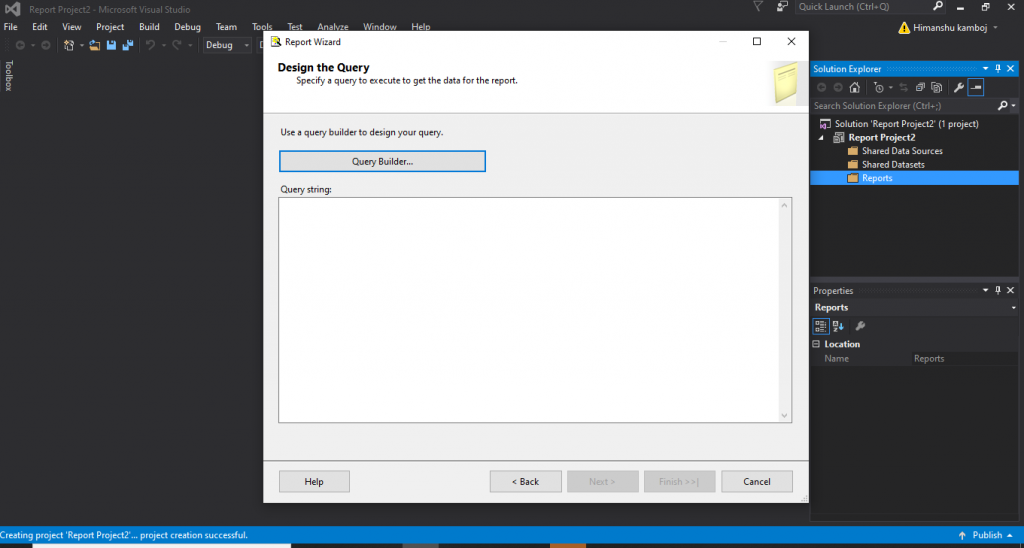
- After clicking ok you will see this window below, here you have set the data source properties like connection string and type. In the connection string, you have to put the URL of your organization.
- Now you must put your fetch query here in this query string.
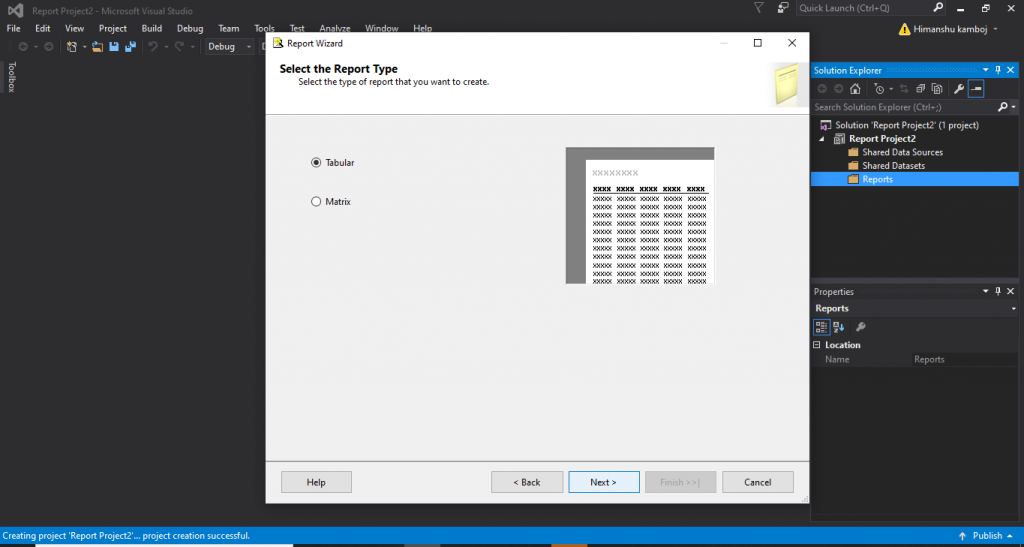
- Select the type of report tabular or matrix.
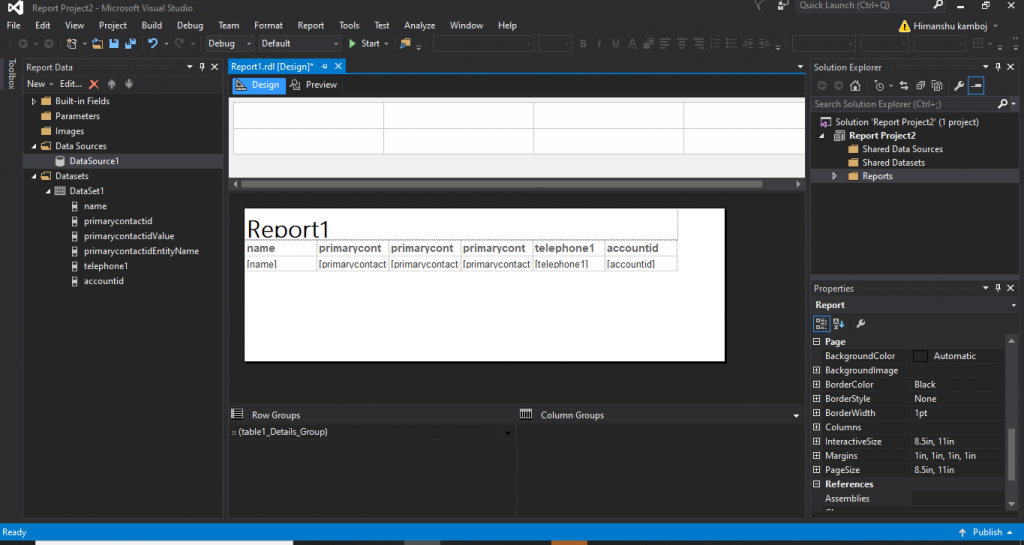
- Now report is ready to run, you can preview the report by clicking the preview button.
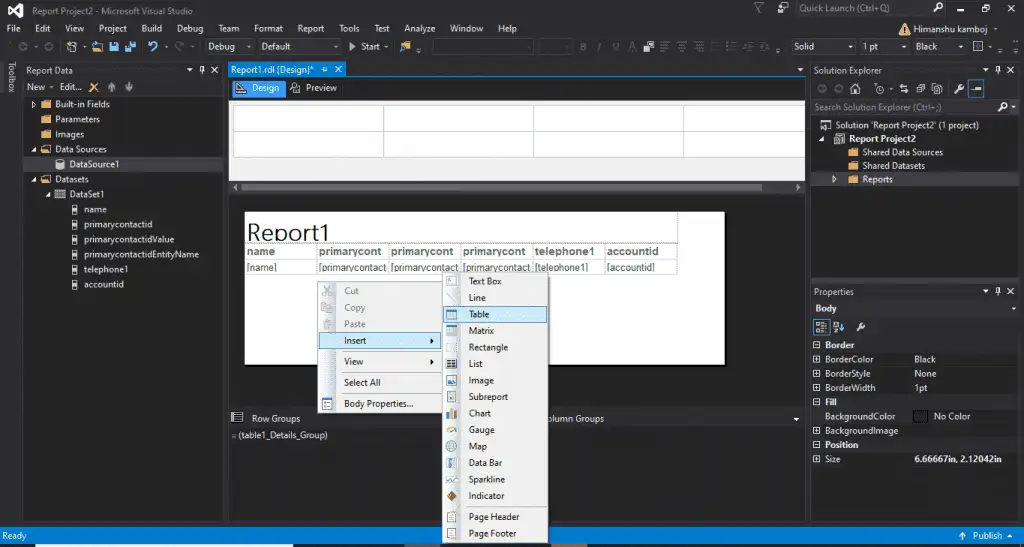
- If you want to use more features of the report, then you can right-click on the screen and can insert the items according to you.
What is RDL?
Report Definition Language is shortly known as RDL. It defines all possible aspects of a report using an XML grammar which is validated by an XML schema.
The description of an individual report is based on RDL. It includes instructions for rendering the design of the report at the run time.
Tabular Reports
Use a table to display detailed data, manage the data in row groups, or both. The Table template includes three columns with a detailed row for data and a table header row.
The following figure illustrates the initial table template, selected on the design surface:
Table template on the design surface, selected.
You can group data by writing your expression, by a single field, or by multiple fields. You can build nested groups or independent, adjacent groups and show aggregated values for grouped data, or add totals to groups. For instance, if your table contains a row group named [Category], you can add a subtotal for each group and a total for the report. To enhance the appearance of the table and highlight the data you want to spotlight, you can combine cells and apply formatting to data and table headings.
You can initially hide detail or group data and incorporate drill-down toggles to allow a user to interactively select how much data to show.
Matrix Reports
Matrix is as simple as a tabular form of SSRS, but it will show the data grouped by rows and columns while in the tabular form data is only grouped by the rows. Some of the data you might expect to see in a row can become a column header. This is like using a pivot table in a spreadsheet.
At run time, the matrix can add the columns and rows according to your fetch XML or SQL query as the report data and data regions are combined, a matrix grows horizontally and vertically on the page.
Also, read: Power of Microsoft Power BI
Example of SSRS reporting
- SSRS used in Medical Research Institute.
- Consider an SSRS report sample of a medical research institute where patients are recruited for different clinical trials.
- The team in the institute builds a database record for each patient.
- Once they agree to be part of the trial, and the hospital receives the payment from the pharmaceutical company based on the price at which it is willing to participate.
- Without SSRS, the medical institutions would be required to manually email a report to the pharma company with the total number of weekly participants. The institute also needs to add details of the number of drugs used, every patient included in the trial, and all the unwanted situations. As a result, the time consumed to gather and send this data in the proper format may consume loads of valuable time in the clinic.
- If the institute were recording data, with the use of the SSRS tool, they would be able to create on-demand reports in a pre-defined format.
- The drug corporation can access the report on the cloud with SSRS, it can also run the report at any time to obtain the latest data from the clinic.
Wrapping Up
SQL Server Reporting Services (SSRS) offer a set of on-premises tools and services that build, deploy, and handle paginated and mobile paginated reports. The SSRS solution flexibly provides accurate information to the correct users. Users can ingest the reports through a web browser, on their mobile device, or through email. Also, the latest release of SSDT comprises the project templates for SQL Server 2016 Reporting Services or later (SSRS): Report Server Project and Report Server Project Wizard.
Microsoft Power Platform Consulting
Still, have a question? You are free to contact me or other experts in our team to showcase the real power of PowerApps to you.