Manvirender Singh Rawat has more than 17+ years of diverse experience with the ability to produce innovative and exceptional results. He has been in leadership roles where he has successfully delivered multiple projects at national and international levels. Manvirender has joined Cynoteck as Data Science Consultant. He has diverse experience in data analytics, visualization, and advanced analytics. He Read More
We are Microsoft Gold partner with its presence across the United States and India. We are a dynamic and professional IT services provider that serves enterprises and startups, helping them meet the challenges of the global economy. We offer services in the area of CRM Consultation and implementation, Application development, Mobile application development, Web development & Offshore Development.
Statistical Analysis Methods you can use to make Business Decisions
An Introduction to Statistical Methods and Data Analysis
Data is a driving force in business. Professionals are increasingly harnessing an unparalleled volume of data to drive their success. Analytical abilities are necessary to evaluate data and apply it across all corporate tasks.
Statistical analysis is the basis for many business analytics approaches, and gaining a firm understanding of different statistical analysis methods is one of the first steps to unlocking the power of business analytics. With this information, you can interpret data, predict consequences, and make better judgments.
In today's data-driven environment, businesses that prioritize analytical skills and statistical knowledge are better positioned to capture the full potential of their data, helping them to drive innovation, optimize operations, and survive in an increasingly competitive market.
Let us discuss in detail the importance of statistical analysis. Also, the different methods you can use for better decisions:
What is Statistical Analysis?
To find patterns and trends, statistical analysis, often known as statistics, involves gathering, organizing, and analyzing data based on predetermined principles. It is a vast study with applications in a variety of sectors, including engineering, business, social sciences, genetics, and population studies, etc.
Statistical analysis serves many purposes. It can be used to anticipate the future, run simulations, build models, lower risk, and spot trends.
Thanks to improved technology, many organizations now have vast amounts of data on every aspect of their operations and markets. Businesses use statistical analysis approaches to organize their data, make sense of it, and use it as a tool to make precise judgments and long-term forecasts.
Data owners can use statistical analysis to undertake business intelligence tasks that strengthen their competitive advantage, increase productivity, and best use resources for a maximum return on investment.
In the study of biomedical data, choosing a suitable statistical method is a crucial step. The interpretation of the results can be seriously hampered by improper statistical method selection, which also has an impact on the study's conclusion.
Imagine you run a small bakery and your sales have been declining over the past few months. You suspect it might be due to the recent changes you made to your menu, but without statistical analysis, you can't be sure.
With statistical analysis, you can dig into your sales data to identify the exact point when the decline started and correlate it with the changes in your menu.
This can help you discover which items are no longer popular or whether your pricing strategy needs adjusting.
In short, statistical analysis provides you with the evidence you need to make informed decisions and potentially save your bakery from further decline.
In statistics, for each specific situation, statistical methods are available for analysis and interpretation of the data. To select the appropriate statistical method, one needs to know the assumption and conditions of the statistical methods, so that the proper statistical method can be selected for data analysis.
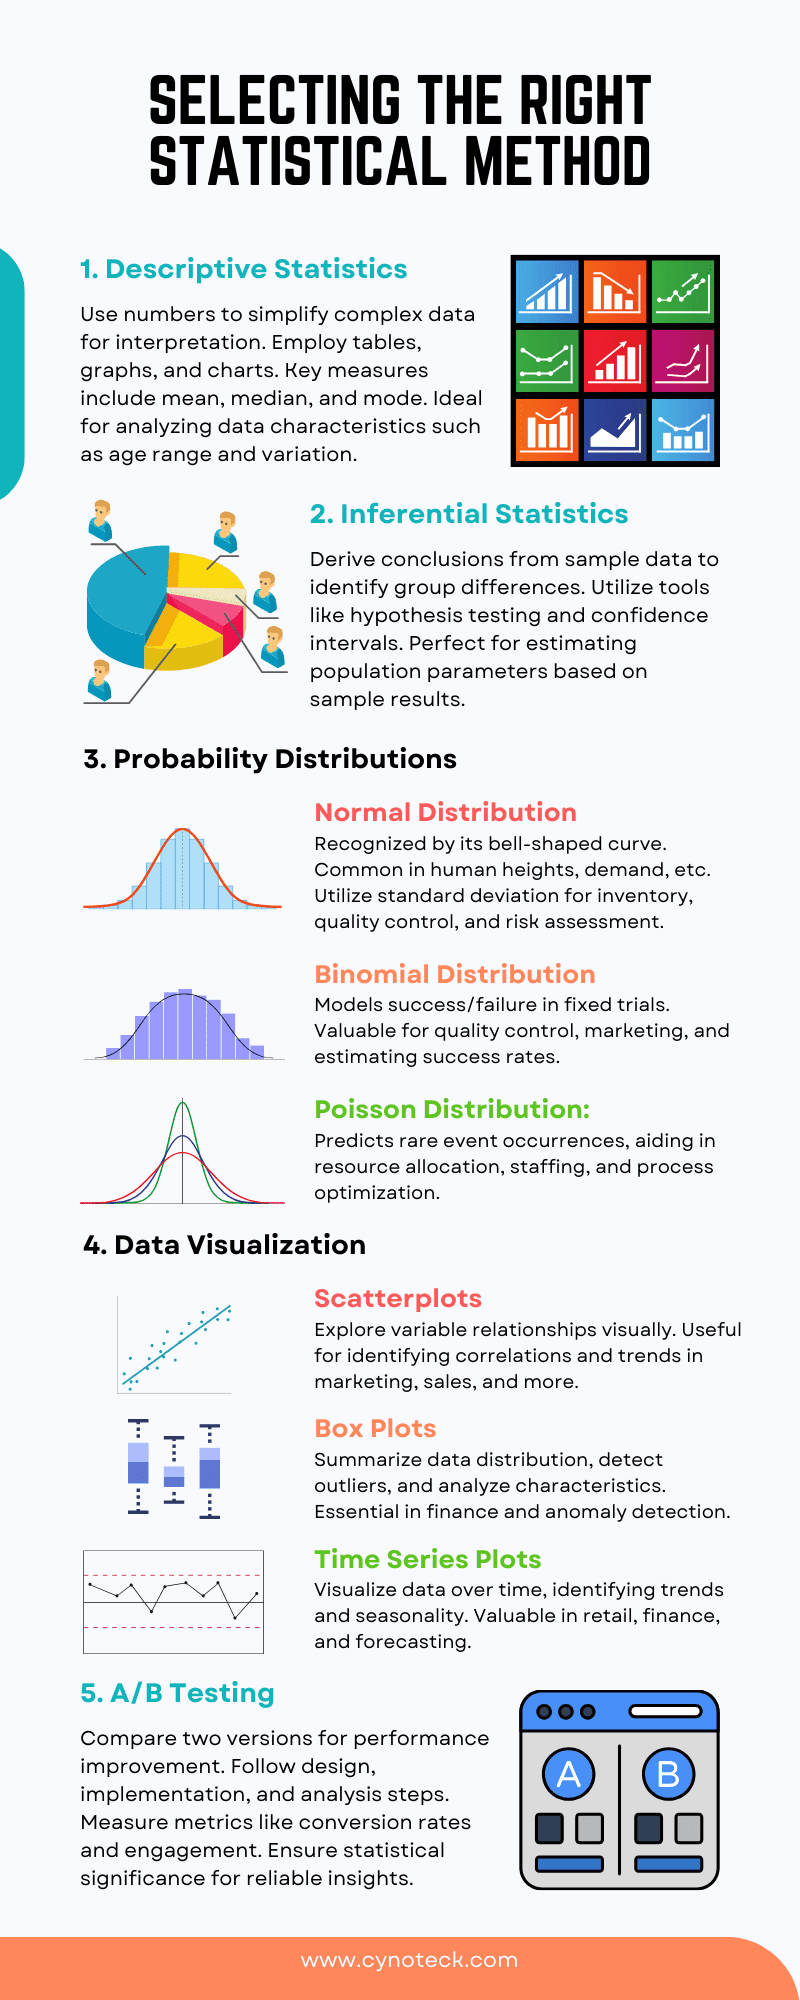
The most basic type of statistical analysis is descriptive statistics, it uses numbers to describe the characteristics of a data set. It makes complex data sets easier to interpret by condensing them into smaller, simpler forms.
You can represent a whole sample in a research population or summarize the data from a sample using descriptive statistics.
To facilitate analysis and understanding, descriptive statistics use data visualization tools such as tables, graphs, and charts.
Descriptive statistics, however, are not appropriate for drawing inferences. It can only represent data so that more advanced statistical analysis techniques can be used to make judgments.
Statistics that describe groups can use measures of central tendency, which use a single value to describe them. Finding the key figure for a given data set involves using the mean, median, and mode.
The average age of drivers in a municipality who have received a citation, for instance, can be determined using descriptive statistical analysis. You can determine the spread using descriptive statistics.
For example, you can find the age range of drivers with DUI and at-fault car accidents in a state. Range, variation, and standard deviation are methods for determining a measure of spread.
2. Inferential Statistics:
Based on the results of a sample group, inferential statistical analysis is used to derive conclusions or inferences about a broader population. It can assist researchers in identifying differences between groups present in a sample.
Inferential statistics are also used to validate generalizations made about a population from a sample due to their ability to account for errors in conclusions made about a segment of a larger group.
Researchers estimate the population's parameters from the sample when conducting inferential statistical analysis.
Additionally, they can conduct a statistical hypothesis test to determine a confidence interval that confirms or refutes the generalizations drawn from the sample.
The normal distribution, also known as the Gaussian distribution, is a fundamental probability distribution characterized by its bell-shaped curve.
It has several key properties, including symmetry around its mean, with most data points clustered around the mean. The spread of data in a normal distribution is determined by the standard deviation.
Data was within one standard deviation of the mean in 68% of the cases, within two standard deviations in 95% of the cases, and within three standard deviations in 99.7% of the cases.
The normal distribution is of paramount importance in business analysis because many natural phenomena, such as human heights, test scores, and product demand, tend to follow this distribution.
Understanding the normal distribution allows businesses to make informed decisions about inventory management, quality control, and risk assessment, making it a cornerstone in statistical analysis and decision-making processes.
The binomial distribution is a discrete probability distribution used to model the number of successes in a fixed number of independent Bernoulli trials. Each trial can result in either success or failure, with a fixed probability of success (p) and failure (q = 1 - p). Characteristics of the binomial distribution include a discrete nature, two outcomes per trial, and a defined number of trials.
It finds numerous applications in business decision-making, such as in quality control, where it can be used to assess the probability of a certain number of defective products in a sample.
Additionally, it is crucial in marketing, as it can help estimate the success rate of marketing campaigns and customer response to promotions. Binomial distribution is a valuable tool for businesses aiming to make data-driven decisions in scenarios involving binary outcomes.
The Poisson distribution is a discrete probability distribution used to model the number of events that occur in a fixed interval of time or space when the events are rare and independent.
It is characterized by a single parameter, λ (lambda), which represents the average rate of event occurrences. The Poisson distribution is particularly useful in business contexts when dealing with rare events, such as customer arrivals at a service center, website visits, or equipment failures.
It helps estimate the likelihood of a specific number of events happening within a given period. Businesses can utilize the Poisson distribution for resource allocation, staffing, and inventory management by understanding the probability of events occurring within their operations.
This distribution is an essential tool for businesses to make informed decisions and optimize their processes.
Scatterplots are powerful data visualization tools used to explore relationships between two continuous variables. They display data points as individual dots on a two-dimensional graph, with one variable on the x-axis and the other on the y-axis. By plotting data in this manner, analysts can visually assess patterns, correlations, and trends within the data.
Scatterplots are especially valuable in identifying the strength and direction of relationships between variables, helping businesses make data-driven decisions.
For example, in marketing, a scatterplot could reveal a positive correlation between advertising spending and sales revenue, indicating that increased advertising investment may lead to higher revenues.
Box plots, also known as box-and-whisker plots, provide a concise summary of data distribution and are instrumental in identifying outliers and key characteristics of a dataset.
A box plot consists of a rectangular "box" that represents the interquartile range (IQR) of the data, with a line inside indicating the median.
"Whiskers" extend from the box to the minimum and maximum values within a defined range, allowing for the detection of outliers. These plots are useful for quickly assessing the spread, central tendency, and skewness of data, making them invaluable in various business applications.
For instance, in finance, box plots can help investors understand the distribution of stock returns and identify potential anomalies or extreme values that may warrant further investigation.
Also, time series plots are essential for visualizing data collected over successive time intervals, making them crucial for analyzing trends and seasonality in business data.
These plots typically use line graphs to represent data points over time, allowing analysts to observe how variables change over temporal periods. Time series plots are invaluable in forecasting and decision-making.
For instance, in retail, time series analysis can help identify seasonal sales patterns, enabling businesses to optimize inventory and marketing strategies.
In finance, time series plots can be used to track stock prices over time, assisting investors in identifying trends and making informed investment decisions.
A/B testing, also known as split testing, is a method used to compare two different versions (A and B) of a webpage, app feature, marketing campaign, or other elements to determine which version performs better in terms of specific key performance indicators (KPIs).
It is a valuable tool for businesses because it allows them to make data-driven decisions by conducting controlled experiments.
A/B testing provides insights into user preferences and behaviors, helping organizations optimize their offerings and strategies to improve customer engagement, conversion rates, and overall business performance.
The successful execution of A/B tests depends on careful design and implementation. This phase involves careful planning, including defining clear objectives, selecting the elements to be tested (e.g., headlines, images, or user interfaces), and randomly assigning users or visitors to either the A or B group.
It is crucial to choose appropriate metrics that align with the test's goals and to determine the required sample sizes to achieve statistically significant results. A well-designed A/B test ensures that the insights gained are reliable, allowing businesses to make informed decisions about which variant to adopt.
Analyzing A/B test results is the critical final step in the process. This phase involves comparing the performance of the A and B groups and interpreting the data to make data-driven decisions. Statistical significance plays a pivotal role in determining the validity of the results.
Additionally, it is essential to be aware of common pitfalls, such as drawing premature conclusions or failing to account for external factors that may impact the results. Rigorous analysis ensures that the insights derived from A/B testing are reliable and can guide improvements, ultimately leading to enhanced user experiences and better business outcomes.
Statistical analysis is the solid foundation of informed business decisions. It empowers organizations to extract valuable insights from data, enabling them to understand customer behavior, optimize operations, and stay ahead in competitive markets. By using the power of statistics, businesses can make evidence-based choices that lead to increased efficiency, profitability, and customer satisfaction.
Businesses of all sizes and industries must fully embrace data-driven strategies. In today's digital age, data is an invaluable asset, and those who leverage it effectively will thrive. Embracing data-driven decision-making not only enhances competitiveness but also promotes innovation and agility.
Let us always remember that the journey of continuous learning and the application of statistical methods in the business context is ongoing. As technology and markets evolve, so must our analytical approaches. By doing so, we can navigate the complexities of the modern business landscape with confidence, ultimately achieving sustainable success in an increasingly data-centric world.
Q. What is the significance of using statistical analysis methods in business decision-making?
Statistical analysis methods provide objective insights, helping businesses make informed choices based on data rather than intuition, ultimately improving performance and profitability.
Q. Can you explain the difference between descriptive and inferential statistics in business analysis?
Descriptive statistics summarize and describe data, while inferential statistics draw conclusions and make predictions about populations based on sample data, aiding in decision-making.
Q. How do confidence intervals benefit businesses in decision-making?
Confidence intervals offer a range of values within which a parameter is likely to fall, providing decision-makers with a degree of certainty and allowing for more accurate risk assessment.
Q. What is the role of A/B testing in business, and how does it contribute to data-driven decisions?
A/B testing helps businesses compare two or more variations of a strategy to determine which one performs better, enabling data-driven choices for optimizing processes and marketing campaigns.
Q. Why are data visualization techniques like scatterplots and box plots important for business analysts?
Data visualization methods simplify complex data, making trends and patterns more accessible, helping in quicker decision-making, and facilitating effective communication of insights within an organization.
An Introduction to Statistical Methods and Data Analysis
Data is a driving force in business. Professionals are increasingly harnessing an unparalleled volume of data to drive their success. Analytical abilities are necessary to evaluate data and apply it across all corporate tasks.
Statistical analysis is the basis for many business analytics approaches, and gaining a firm understanding of different statistical analysis methods is one of the first steps to unlocking the power of business analytics. With this information, you can interpret data, predict consequences, and make better judgments.
In today’s data-driven environment, businesses that prioritize analytical skills and statistical knowledge are better positioned to capture the full potential of their data, helping them to drive innovation, optimize operations, and survive in an increasingly competitive market.
Let us discuss in detail the importance of statistical analysis. Also, the different methods you can use for better decisions:
To find patterns and trends, statistical analysis, often known as statistics, involves gathering, organizing, and analyzing data based on predetermined principles. It is a vast study with applications in a variety of sectors, including engineering, business, social sciences, genetics, and population studies, etc.
Statistical analysis serves many purposes. It can be used to anticipate the future, run simulations, build models, lower risk, and spot trends.
Thanks to improved technology, many organizations now have vast amounts of data on every aspect of their operations and markets. Businesses use statistical analysis approaches to organize their data, make sense of it, and use it as a tool to make precise judgments and long-term forecasts.
Data owners can use statistical analysis to undertake business intelligence tasks that strengthen their competitive advantage, increase productivity, and best use resources for a maximum return on investment.
In the study of biomedical data, choosing a suitable statistical method is a crucial step. The interpretation of the results can be seriously hampered by improper statistical method selection, which also has an impact on the study’s conclusion.
Imagine you run a small bakery and your sales have been declining over the past few months. You suspect it might be due to the recent changes you made to your menu, but without statistical analysis, you can’t be sure.
With statistical analysis, you can dig into your sales data to identify the exact point when the decline started and correlate it with the changes in your menu.
This can help you discover which items are no longer popular or whether your pricing strategy needs adjusting.
In short, statistical analysis provides you with the evidence you need to make informed decisions and potentially save your bakery from further decline.
In statistics, for each specific situation, statistical methods are available for analysis and interpretation of the data. To select the appropriate statistical method, one needs to know the assumption and conditions of the statistical methods, so that the proper statistical method can be selected for data analysis.
The most basic type of statistical analysis is descriptive statistics, it uses numbers to describe the characteristics of a data set. It makes complex data sets easier to interpret by condensing them into smaller, simpler forms.
You can represent a whole sample in a research population or summarize the data from a sample using descriptive statistics.
To facilitate analysis and understanding, descriptive statistics use data visualization tools such as tables, graphs, and charts.
Descriptive statistics, however, are not appropriate for drawing inferences. It can only represent data so that more advanced statistical analysis techniques can be used to make judgments.
Statistics that describe groups can use measures of central tendency, which use a single value to describe them. Finding the key figure for a given data set involves using the mean, median, and mode.
The average age of drivers in a municipality who have received a citation, for instance, can be determined using descriptive statistical analysis. You can determine the spread using descriptive statistics.
For example, you can find the age range of drivers with DUI and at-fault car accidents in a state. Range, variation, and standard deviation are methods for determining a measure of spread.
2. Inferential Statistics:
Based on the results of a sample group, inferential statistical analysis is used to derive conclusions or inferences about a broader population. It can assist researchers in identifying differences between groups present in a sample.
Inferential statistics are also used to validate generalizations made about a population from a sample due to their ability to account for errors in conclusions made about a segment of a larger group.
Researchers estimate the population’s parameters from the sample when conducting inferential statistical analysis.
Additionally, they can conduct a statistical hypothesis test to determine a confidence interval that confirms or refutes the generalizations drawn from the sample.
The normal distribution, also known as the Gaussian distribution, is a fundamental probability distribution characterized by its bell-shaped curve.
It has several key properties, including symmetry around its mean, with most data points clustered around the mean. The spread of data in a normal distribution is determined by the standard deviation.
Data was within one standard deviation of the mean in 68% of the cases, within two standard deviations in 95% of the cases, and within three standard deviations in 99.7% of the cases.
The normal distribution is of paramount importance in business analysis because many natural phenomena, such as human heights, test scores, and product demand, tend to follow this distribution.
Understanding the normal distribution allows businesses to make informed decisions about inventory management, quality control, and risk assessment, making it a cornerstone in statistical analysis and decision-making processes.
The binomial distribution is a discrete probability distribution used to model the number of successes in a fixed number of independent Bernoulli trials. Each trial can result in either success or failure, with a fixed probability of success (p) and failure (q = 1 – p). Characteristics of the binomial distribution include a discrete nature, two outcomes per trial, and a defined number of trials.
It finds numerous applications in business decision-making, such as in quality control, where it can be used to assess the probability of a certain number of defective products in a sample.
Additionally, it is crucial in marketing, as it can help estimate the success rate of marketing campaigns and customer response to promotions. Binomial distribution is a valuable tool for businesses aiming to make data-driven decisions in scenarios involving binary outcomes.
The Poisson distribution is a discrete probability distribution used to model the number of events that occur in a fixed interval of time or space when the events are rare and independent.
It is characterized by a single parameter, λ (lambda), which represents the average rate of event occurrences. The Poisson distribution is particularly useful in business contexts when dealing with rare events, such as customer arrivals at a service center, website visits, or equipment failures.
It helps estimate the likelihood of a specific number of events happening within a given period. Businesses can utilize the Poisson distribution for resource allocation, staffing, and inventory management by understanding the probability of events occurring within their operations.
This distribution is an essential tool for businesses to make informed decisions and optimize their processes.
Scatterplots are powerful data visualization tools used to explore relationships between two continuous variables. They display data points as individual dots on a two-dimensional graph, with one variable on the x-axis and the other on the y-axis. By plotting data in this manner, analysts can visually assess patterns, correlations, and trends within the data.
Scatterplots are especially valuable in identifying the strength and direction of relationships between variables, helping businesses make data-driven decisions.
For example, in marketing, a scatterplot could reveal a positive correlation between advertising spending and sales revenue, indicating that increased advertising investment may lead to higher revenues.
Box plots, also known as box-and-whisker plots, provide a concise summary of data distribution and are instrumental in identifying outliers and key characteristics of a dataset.
A box plot consists of a rectangular “box” that represents the interquartile range (IQR) of the data, with a line inside indicating the median.
“Whiskers” extend from the box to the minimum and maximum values within a defined range, allowing for the detection of outliers. These plots are useful for quickly assessing the spread, central tendency, and skewness of data, making them invaluable in various business applications.
For instance, in finance, box plots can help investors understand the distribution of stock returns and identify potential anomalies or extreme values that may warrant further investigation.
Also, time series plots are essential for visualizing data collected over successive time intervals, making them crucial for analyzing trends and seasonality in business data.
These plots typically use line graphs to represent data points over time, allowing analysts to observe how variables change over temporal periods. Time series plots are invaluable in forecasting and decision-making.
For instance, in retail, time series analysis can help identify seasonal sales patterns, enabling businesses to optimize inventory and marketing strategies.
In finance, time series plots can be used to track stock prices over time, assisting investors in identifying trends and making informed investment decisions.
A/B testing, also known as split testing, is a method used to compare two different versions (A and B) of a webpage, app feature, marketing campaign, or other elements to determine which version performs better in terms of specific key performance indicators (KPIs).
It is a valuable tool for businesses because it allows them to make data-driven decisions by conducting controlled experiments.
A/B testing provides insights into user preferences and behaviors, helping organizations optimize their offerings and strategies to improve customer engagement, conversion rates, and overall business performance.
The successful execution of A/B tests depends on careful design and implementation. This phase involves careful planning, including defining clear objectives, selecting the elements to be tested (e.g., headlines, images, or user interfaces), and randomly assigning users or visitors to either the A or B group.
It is crucial to choose appropriate metrics that align with the test’s goals and to determine the required sample sizes to achieve statistically significant results. A well-designed A/B test ensures that the insights gained are reliable, allowing businesses to make informed decisions about which variant to adopt.
Analyzing A/B test results is the critical final step in the process. This phase involves comparing the performance of the A and B groups and interpreting the data to make data-driven decisions. Statistical significance plays a pivotal role in determining the validity of the results.
Additionally, it is essential to be aware of common pitfalls, such as drawing premature conclusions or failing to account for external factors that may impact the results. Rigorous analysis ensures that the insights derived from A/B testing are reliable and can guide improvements, ultimately leading to enhanced user experiences and better business outcomes.
Statistical analysis is the solid foundation of informed business decisions. It empowers organizations to extract valuable insights from data, enabling them to understand customer behavior, optimize operations, and stay ahead in competitive markets. By using the power of statistics, businesses can make evidence-based choices that lead to increased efficiency, profitability, and customer satisfaction.
Businesses of all sizes and industries must fully embrace data-driven strategies. In today’s digital age, data is an invaluable asset, and those who leverage it effectively will thrive. Embracing data-driven decision-making not only enhances competitiveness but also promotes innovation and agility.
Let us always remember that the journey of continuous learning and the application of statistical methods in the business context is ongoing. As technology and markets evolve, so must our analytical approaches. By doing so, we can navigate the complexities of the modern business landscape with confidence, ultimately achieving sustainable success in an increasingly data-centric world.
Q. What is the significance of using statistical analysis methods in business decision-making?
Statistical analysis methods provide objective insights, helping businesses make informed choices based on data rather than intuition, ultimately improving performance and profitability.
Q. Can you explain the difference between descriptive and inferential statistics in business analysis?
Descriptive statistics summarize and describe data, while inferential statistics draw conclusions and make predictions about populations based on sample data, aiding in decision-making.
Q. How do confidence intervals benefit businesses in decision-making?
Confidence intervals offer a range of values within which a parameter is likely to fall, providing decision-makers with a degree of certainty and allowing for more accurate risk assessment.
Q. What is the role of A/B testing in business, and how does it contribute to data-driven decisions?
A/B testing helps businesses compare two or more variations of a strategy to determine which one performs better, enabling data-driven choices for optimizing processes and marketing campaigns.
Q. Why are data visualization techniques like scatterplots and box plots important for business analysts?
Data visualization methods simplify complex data, making trends and patterns more accessible, helping in quicker decision-making, and facilitating effective communication of insights within an organization.
Harness the power of Data Science
Unlock hidden opportunities, optimize processes, and make smarter decisions. Contact us today to discover how our Data Science services can propel your organization forward. Don't let your data go untapped. Take action now and revolutionize your business with Data Science.