Salesforce is presently the top CRM for businesses, regardless of the firm’s size. And multiple Salesforce modules are used by businesses worldwide to improve the experiences of customers and employees. Although Salesforce is excellent as a system of records, the ability to analyze, interpret and extract actionable insights from the data which Salesforce gathers within it, is also very crucial.
Are you finding it difficult to make sense of the data that has been collected in your Salesforce environment? That is what sales analytics dashboards are for. If you use Salesforce, you need to understand how important it is to interpret your data.
Data can be sorted in a way that makes the most sense for your team using Salesforce dashboards, which allow you to take data from various reports and represent it in different ways.
One of the most practical things included with Salesforce right out of the box is dashboards. Salesforce dashboards offer a wonderful way to review and assess your data. They are helpful for visually presenting reports. The reason for this is that they are simpler to view and comprehend than reading a report.
Dashboards help you visually understand shifting business situations so that you may make decisions based on the real-time data that was collected through reports.
For a variety of teams and departments, including sales, marketing, and customer support, they can be used to analyze data and measure key performance indicators (KPIs).
These dashboards furthermore allow users to track the results of their actions, identify patterns, and sort out quantities. Depending on their permissions, all users inside an org can see Salesforce sales analytics dashboards.
Now, let us explore Salesforce Dashboards, how to create a dashboard in Salesforce, and more details in this blog.
What is Salesforce Dashboard?
Salesforce dashboards are visual presentations of data that can include graphs, bar charts, pie charts, tables, scatter plots, gauges, metrics, funnel diagrams, and other visuals.
A Salesforce dashboard can help with “determining trends, sorting out amounts, and monitoring the impact of their operations” by providing a quick method to see important data from one or more Salesforce reports. Using a Salesforce dashboard, it is easy to show summary data from multiple reports at once.
Several database tools make it simple to store and transport data, but this data is only truly effective when it can be properly analyzed to provide a better knowledge of some crucial growth-related aspects. In being able to draw trends and patterns from the previously collected data points, Salesforce Dashboards serve precisely that function.
Anyone with the ability to execute reports and access a specific report folder can view dashboards. In contrast to Salesforce reports, dashboards need to be refreshed to provide the most recent data. They provide a brief overview of your business’s or organization’s key performance metrics and growth indicators.
Sales analytics dashboards provide more insights than reports because they compile information from many reports and present a condensed result. You can combine the results of several reports at once by looking at them all.
Dashboard summaries also enable quicker action plan selection. Both Salesforce Classic and Lightning Experience enable these dashboards as an out-of-the-box functionality.
For Salesforce dashboards to be illustrated, dashboard components are required. A Salesforce dashboard can have up to 20 components.
Also, read: Sales Performance Management with Cutting-Edge Technology
Components of Dashboard
Data from source reports are displayed visually in Salesforce dashboards. These dashboard components provide a fast overview of the important KPIs and performance indicators for the organization. The source of the segment’s information, how it appears in the segment, and the type of segment it is all have options to be changed.
An interface for creating and modifying dashboards is known as a dashboard builder. The dashboard can snap, drag, and drop pieces into distinct positions.
Salesforce dashboards can display seven different types of charts: horizontal bar charts, vertical bar charts, line charts, pie charts, donut charts, funnel charts, and scatter charts.
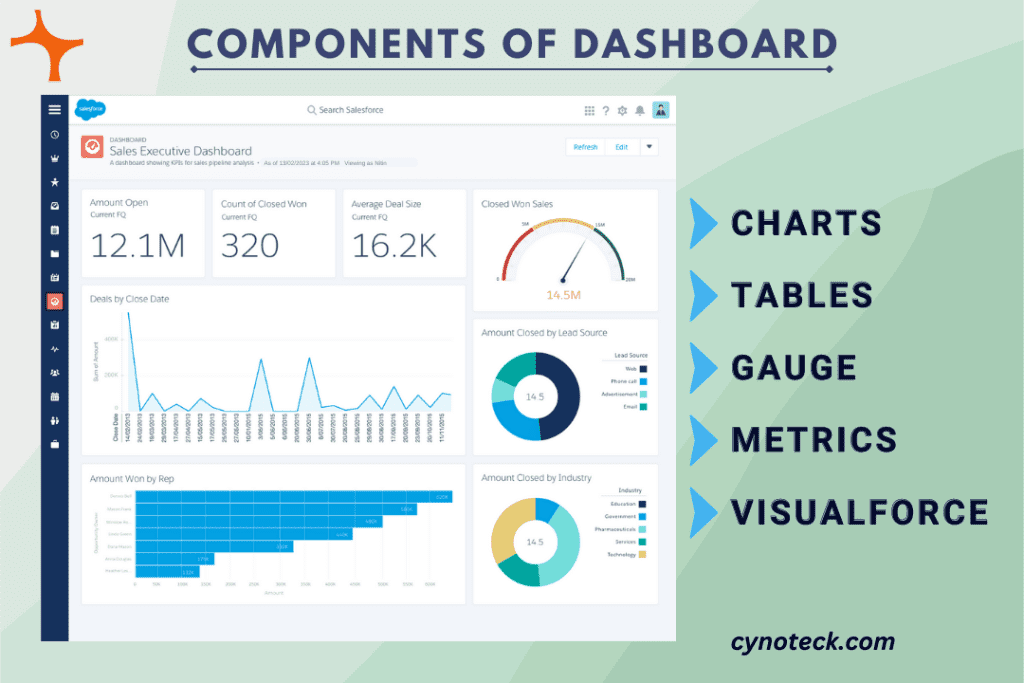
There are 5 different types of Salesforce Dashboard components:
1) Charts
These charts are used to display contrasts. These are further separated into six categories:
- Donuts
- Pie
- Funnels
- Vertical bar graphs
- Horizontal bar graphs
- Line Chart
2) Tables
Lists are displayed with tables.
3) Gauge
A gauge is used to show progress toward a specific target.
4) Metrics
Metrics are used to categorize and show a single number, such as the total from a report.
5) Visualforce
Visualforce shows a Visualforce component as a dashboard. It is employed to obtain data from other data sources.
Also, read: Examples of Sales Reports: From Daily to Advanced
Creating a Dashboard in Salesforce
Businesses sometimes can find that they need an uncomplicated way to display frequent changes to indicative data points. You can create a collection of crucial business data in the form of charts, tables, and KPIs for analysis with a Salesforce Dashboard setup.
It is possible to combine different dashboard elements or just one of them to produce a powerful visual representation of key data points. Additionally, you can also create dynamic dashboards that can incorporate updates from running users in real-time.
The process of creating a dashboard in Salesforce Lightning simply requires a few straightforward steps.
The process listed below is simple to use to construct successful dashboards:
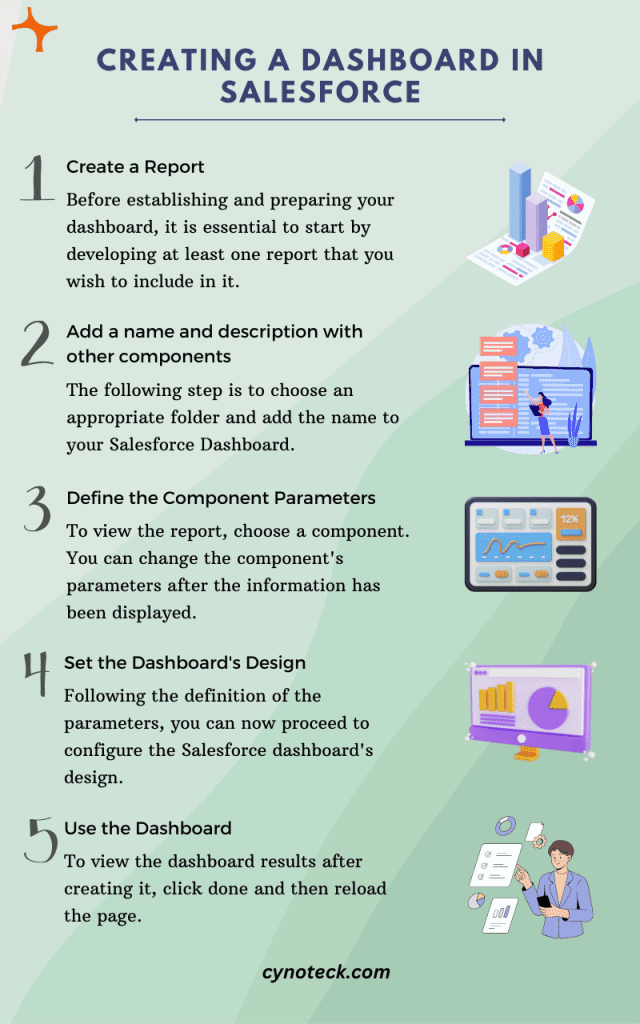
1) Create a Report
Before establishing and preparing your dashboard, it is essential to start by developing at least one report that you wish to include in it. Without the report, you can still create a Salesforce dashboard.
2) Add a name and description with other components
The following step is to choose an appropriate folder and add the name to your Salesforce Dashboard. According to your requirements, you will also need to include the following elements:
Table, Chart, Gauge, and Metric.
Additionally, you can view details about results by using the dashboard’s filtering feature.
3) Define the component parameters
To view the report, choose a component. You can change the component’s parameters after the information has been displayed.
4) Set the Dashboard’s Design
Following the definition of the parameters, you can now proceed to configure the Salesforce dashboard’s design. The dashboard settings have an option from where you can choose the properties.
5) Use the Dashboard
To view the dashboard results after creating it, click done and then reload the page.
Also, read: Using Salesforce Pipeline Reports to Track Your Sales Performance
Step by Step Procedure for creating a dashboard in Salesforce:
To build a dashboard from a single report, follow these steps:
1) Choose “Dashboard” from the menu. Select “New Dashboard” from the menu.
2) To add a report to the dashboard, click the “Component” button.
3) Now you have a choice in how the data would be shown. You might choose “Use chart settings from the report” if you added a chart to your report.
4) To add the chart, click “Add.” The chart can then be scaled to your preferred size.
5) To add a component again in a different view, click anywhere on the dashboard.
6) After choosing an alternative visual display for the same report, click “Add” to include it in the dashboard. After that, you can drag the visualization to adjust its size or position on the dashboard.
7) Keep going until you have everything you require. Click “Save Dashboard” after that.
To dive deeper into the data and discover information, such as the specific accounts at an opportunity stage, you can click on the visualizations from the dashboard.
Salesforce Dashboards Filter
Users can apply several data perspectives to a single dashboard by using dashboard filters. Filter rules apply to domains from the source reports on the dashboard. A user viewing the dashboard can choose a filter to visualize the data that most interests them.
Dynamic Dashboards in Salesforce
With a Salesforce dynamic dashboard, you can show important data to a variety of stakeholders, including employees, CEOs, CFOs, clients, and customers, according to their rights and requirements, without having to construct separate dashboards for each one.
By default, the running user of a dashboard is the person who created it, but you can alter this setting at any moment using the Dynamic Dashboards feature.
Each user can view the data they have access to using customizable Salesforce dashboards, depending on their security, and sharing settings. In the Enterprise Edition, users can have up to 5 Dynamic Dashboards, 10 in the Unlimited and Performance Editions, and 3 in the Developer Edition.
Also, read: Strategies To Improve Salesforce Lead Conversion Rates
Increasing the effectiveness of your business operations with Salesforce dashboards
One of the best features of Salesforce is its dashboards and reporting. The comprehensive visibility required to drive sales performance should be provided through your Salesforce dashboards.
Dashboards are a useful tool for summarizing and comprehending data sets. By providing everyone on your team consolidated access to the most recent data, dashboards can enhance collaboration.
Through automatically updating charts, they can also help you in understanding trends in that data more quickly and simply, allowing you to avoid issues and celebrate achievements.
Every element on a dashboard is dependent on an underlying source report, and when we generate numerous source reports to power a dashboard, they can have various hierarchy settings, and filters, or use various report types.
To help you get the most out of your Salesforce dashboards, here are five high-level recommendations and tips.
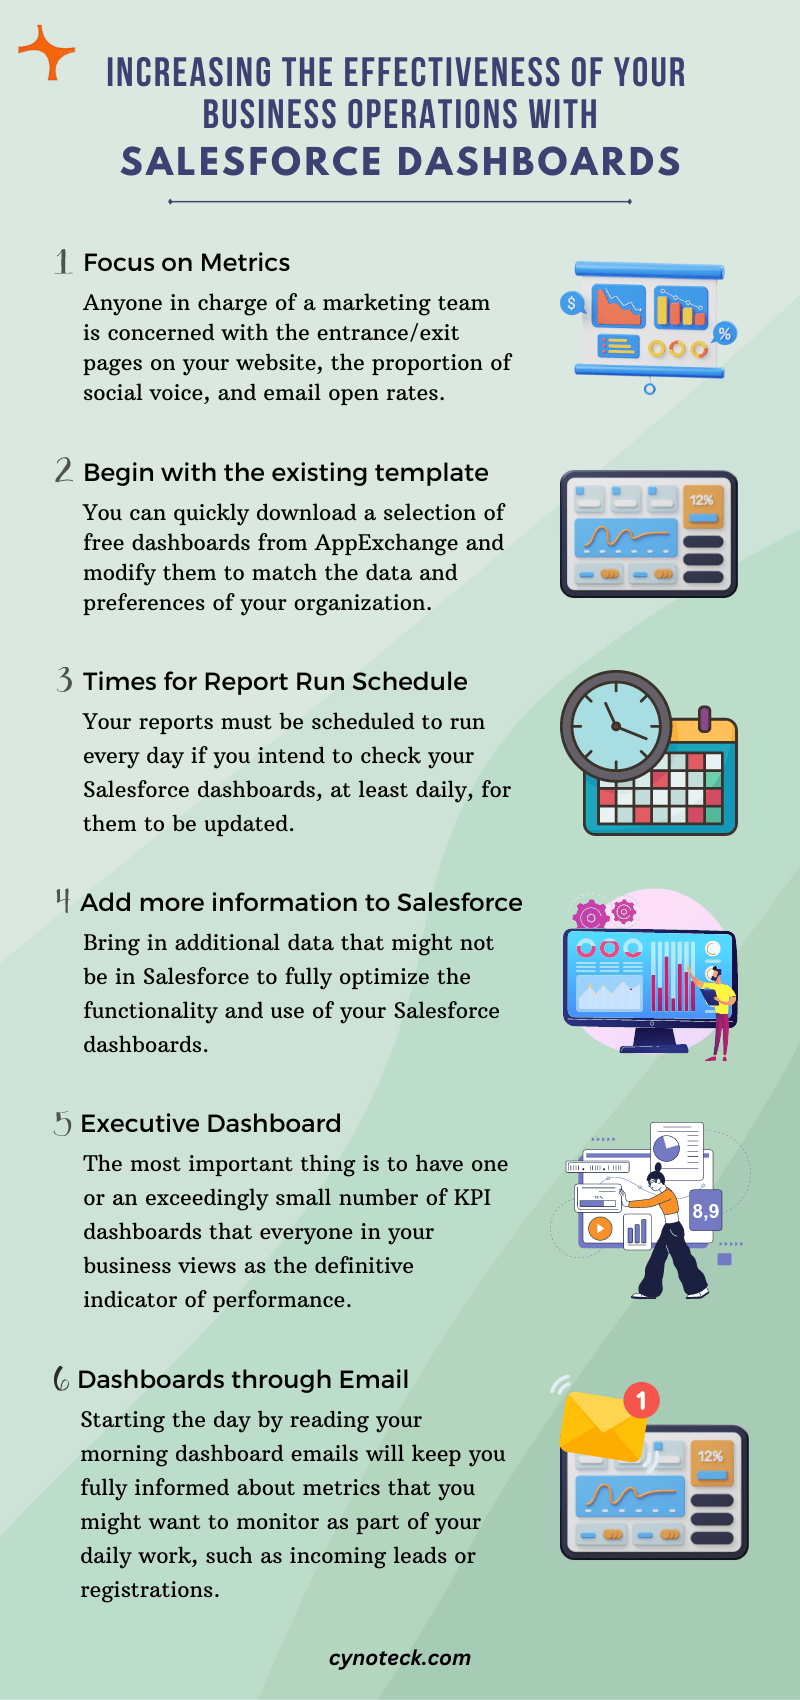
1) Focus on Metrics
The major metrics you will track on your dashboards should be agreed upon by everyone on your team and throughout your entire organization. Of course, anyone in charge of a marketing team is concerned with the entrance/exit pages on your website, the proportion of social voice, and email open rates.
- What measurements are used to measure success across all levels of your organization?
- How do the metrics relate to the objectives of the company?
- How frequently (monthly, quarterly, etc.) should such metrics be evaluated?
2) Begin with the existing template
You do not have to start from scratch with your dashboards if your business is new to Salesforce. You can quickly download a selection of free dashboards from AppExchange and modify them to match the data and preferences of your organization.
In addition to saving you time, customizing pre-existing dashboards provides you with an idea of “best practices” for how other people have constructed their dashboards and produced their reports.
3) Times for Report Run Schedule
The crucial step is ensuring all the reports that will serve as the basis for your dashboards are updated regularly. Your reports must be scheduled to run every day if you intend to check your Salesforce dashboards, at least daily, for them to be updated.
4) Add more information to Salesforce
Bring in additional data that might not be in Salesforce to fully optimize the functionality and use of your Salesforce dashboards.
Your dashboards are not the single source of truth if your sales KPIs are in Salesforce but other operational or business data are in reports that have not been integrated into Salesforce.
One option is to manually import data into Salesforce regularly, but this may prevent the dashboards from being automatically updated with the most up-to-date information.
5) Executive Dashboard
By combining data from multiple sales representatives and territories, this dashboard helps senior managers in their daily job. It offers a current snapshot of all Sales operations that are under your control at any given moment.
The most important thing is to have one or an exceedingly small number of KPI dashboards that everyone in your business views as the definitive indicator of performance.
If you choose, you can have a main KPI dashboard for each department or executive. There can be numerous other dashboards for each functional area or department that illustrate the specifics of the various activities that add up to those KPI dashboards, but only people with a specific area of expertise should use those.
6) Dashboards through Email
Sending dashboard emails to team members and other Salesforce users who might not log in as regularly as they should is a convenient approach to providing information regularly.
Starting the day by reading your morning dashboard emails will keep you fully informed about metrics that you might want to monitor as part of your daily work, such as incoming leads or registrations.
Also, read: Digital Transformation in Healthcare: Key trends in healthcare for 2023
Key characteristics of Salesforce Dashboards
- Drag and drop configurations and built-in graphics are available.
- Show information from specialized source reports.
- View data in real-time instantaneously and automatically.
- Allows users to add or remove display parameters and customize data and layout.
- Set up an automatic emailing of the dashboard to users.
Conclusion
With the use of Salesforce dashboards, businesses can track and examine their data in real time. The “Salesforce Dashboards” tool is a popular, perfect feature since it combines accessibility, usability, and capabilities right out of the box. Both aspiring administrators and senior executives should be able to manage several Salesforce reporting modules. The explanation is straightforward: users will surely use at least one dashboard, if not more if they continue to use Salesforce.
Users can examine their data using charts, graphs, and other visualizations by using the Salesforce sales analytics dashboard. These dashboards can be shared with other users in an organization and configured to display metrics and data types. Dashboards offer the tools you need to gain the information you require, whether you are trying to track key performance metrics, spot trends, or decide on a business strategy.
Also, read: Common Salesforce Integration Challenges And How To Overcome Them
FAQs (Frequently Asked Questions)
Salesforce reports and dashboards display data in different ways but have a 1:1 relationship. Dashboards provide a visual representation of the information from one or more reports in the same workspace. And each report must be created with a specific purpose in mind using tabular views, which are made up of rows and columns and focus on a single goal or insight.
Reliable storefront performance data is calculated by the Salesforce sales analytics dashboards. The data can be used by merchandisers, marketers, and e-commerce teams to make sales, promotions, and product decisions that are smarter and more informed. The precision and fine information that earlier business manager features and independent analytics providers lack are provided by these dashboards. Business users can quickly filter, for instance, by customer type, size, location, device kind, and many other criteria.
There are no predefined dashboards in Salesforce out of the box; you must construct your own. Each user has a maximum of seven dashboard subscriptions. And each organization can have up to five (for Enterprise editions of Salesforce) or ten dynamic dashboards, depending on the edition of Salesforce that your business uses (for Unlimited and Performance).
Salesforce Consulting Services
If you are new to automation and confused about Workflow or Process Builder. Need not to worry, we have got you all covered. Talk to our experts and clear all the cloudy thoughts about automation.