
First, let us tell you about the Power BI, it is a data analysis and visualization tool provided by the Microsoft, Power BI Desktop is free to download on your local computer, but Power BI service is available with licenses. If you are a student and want to learn Power BI, you can go for student license, it is free to use for a year but with limited capabilities.
All you have to do is go to the Microsoft Power BI website, go to the product release section and click on Power BI for students. The documents required to get the student license of Power BI would be your College ID Number, Student ID Card with your photograph attached in it and you must currently enroll in any particular course.
Now let’s come to the topic, have you ever tried to work on any survey-related data, in case if yes then you must have encountered an issue of columns transformation like in the below created scenario.
Problem Statement table:
| Id | Question Column | Answer Column |
| 1 | A | 1 integer format answer |
| 2 | B | String format answer |
| 3 | A | 1 |
| 4 | C | Date Time format Answer |
| 5 | D | 4 |
| 6 | B | String Format Answer |
Now let us describe the above table for you the first column is ID, the second column is your question column in which the questions are getting stored (A, B, C, D are question’s for e.g.) and third, the last column is of answers in which we are storing our answers in different value formats for e.g., like (Integer, Date Time, string type values) in a single column.
Now you want to visualize each question and their values in their individual columns just like in the below-given table, but all the questions are stored in one column (Question Column) in the upper table so it’s not possible right now, so let’s create a solution for it.
Soultion Statement table:
| ID | A | B | C | D | |
| 1 | 1 integer format answer | String format answer | Date Time format Answer | 4 | |
| 2 | 1 integer format answer | String format answer |
Also, read: Power BI: data visualization and business intelligence tool
We are using a live example of data for your understanding. Please follow the below images:
Figure 1: Name column is our question columns in which lots of question are there and they are repetitive in nature also:
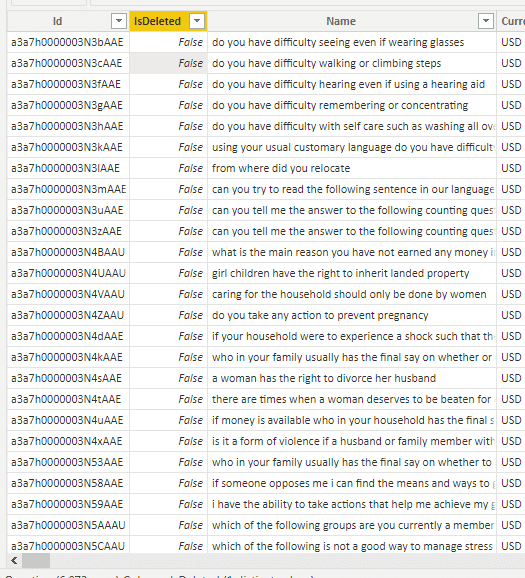
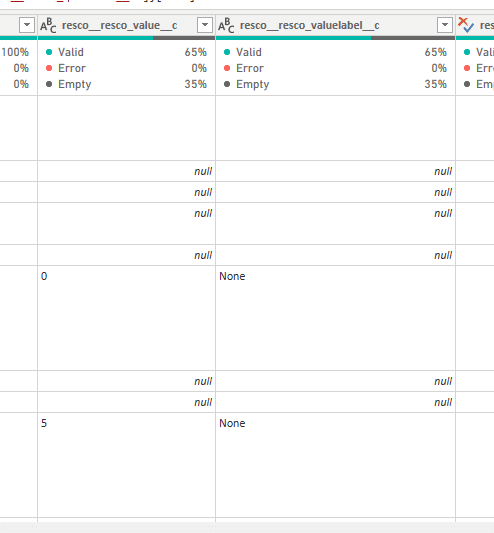
Figure 2: Answers are storing in the resco_value_label_c column.
Now we want to make one column for each question and the answers to each individual question should store in their related question column, so for doing that follow this approach:
- Open Power Query Editor
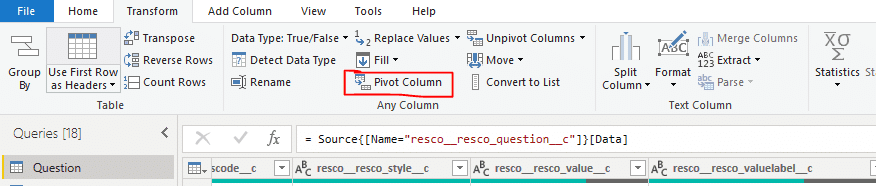
- Click on transform tab in the menu
- Now click on Pivot Column
We are sharing the screenshot of each step:
Figure 3: Step 1
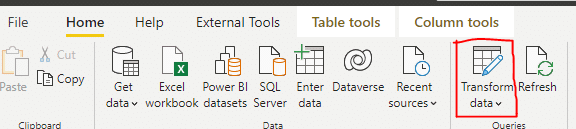
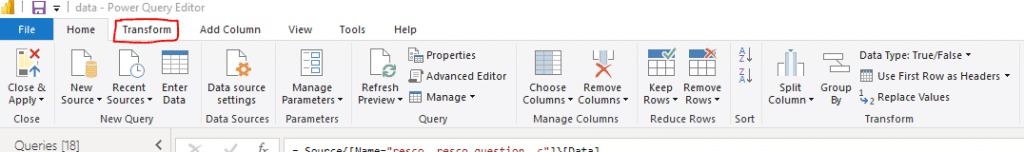
Figure 4: Step 2
Now select the Question column which you want to transform and click on Pivot as shown in below steps:
Figure 5: Step 3- Select the column which you want to pivot and click on Pivot column.
Now select the Value column (The answer column from where you want to supply the values to Newley created columns) and click on advanced options and do not apply any aggregations if you want your answers as it is, or in case if you want to apply any aggregation on your data you can apply from here.
Figure 6: Select the answer column in “value column“
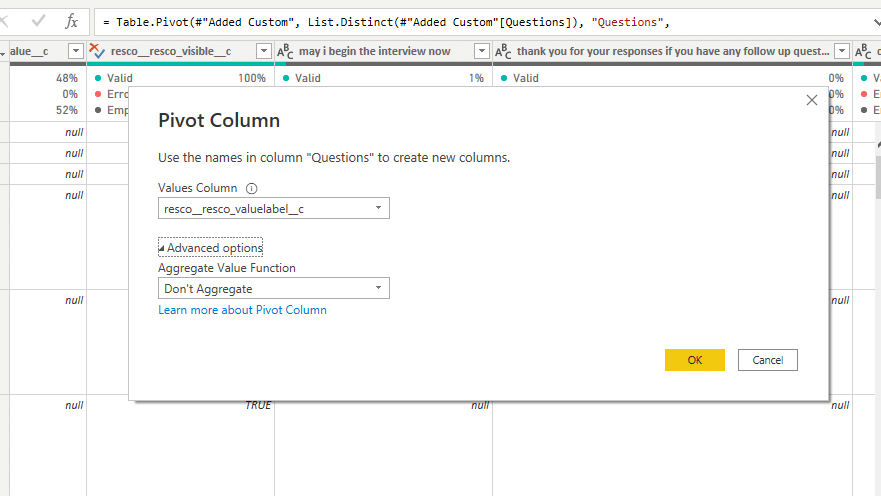
Now click on Ok and wait for the step to apply.
Now you will notice that there is one individual column for every question and their values are also present in them.
Figure 7: Each question has become a new column in case of repetitive questions it will create only one question for them.

So now the above table will look like in this format:
| ID | A | B | C | D |
| 1 | 1 integer format answer | String format answer | Date Time format Answer | 4 |
| 2 | 1 integer format answer | String format answer | ||
| 3 |
Also, read: Microsoft Ignite November 2021 – New Power Platform announcements and capabilities
Conclusion
So, Pivot is simple and uncomplicated to accomplish, but you have to be cautious regarding the nature and quality of the source data set. If it is normal to have a name duplicated in the source data, then aggregation requires to be set appropriately. If you expect each name to occur once, then setting it as “Do Not Aggregate” works nicely because you can utilize the error handling mechanism in Power Query to manage the error somehow.

Microsoft Power platform consulting
Do you want to transform your critical business data into interactive Dashboards and report? Our highly skilled Power BI experts will create a business intelligence road-map to achieving your business goals.