Anshul Verma hails from Dehradun, Uttarakhand (a small town near foothills of Himalayas). He is a computer graduate, the President of Cynoteck Technology Solutions LLC (US). He is also co-author of book titled "Apex Design Patterns" and has presented in various tech events, including Dreamforce. Anshul Verma is married and lives with his wife, their Read More
We are Microsoft Gold partner with its presence across the United States and India. We are a dynamic and professional IT services provider that serves enterprises and startups, helping them meet the challenges of the global economy. We offer services in the area of CRM Consultation and implementation, Application development, Mobile application development, Web development & Offshore Development.
Sort Pipeline by Sales stages with Salesforce Tableau CRM (Einstein Analytics)
Problem Statement
While working on a recent change with a Tableau CRM sales dashboard, we encountered (a bit late) that the sales pipeline view shows sales stages in the incorrect order. Ideally, you would want the pipeline view to reflect the stage in the same sequence as the sales process (for example Prospect, Propose, Negotiate, Close).
Sales Path
Sales Path
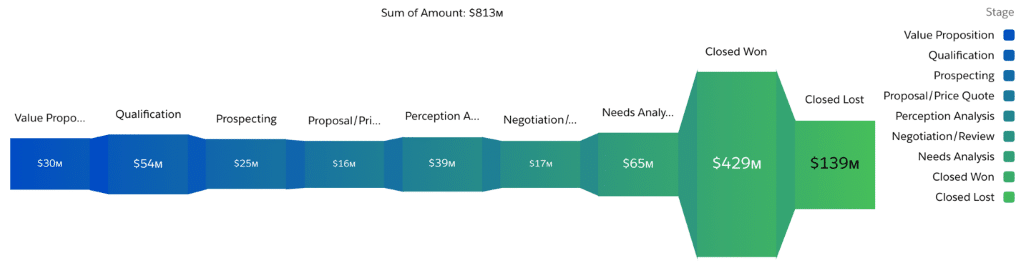
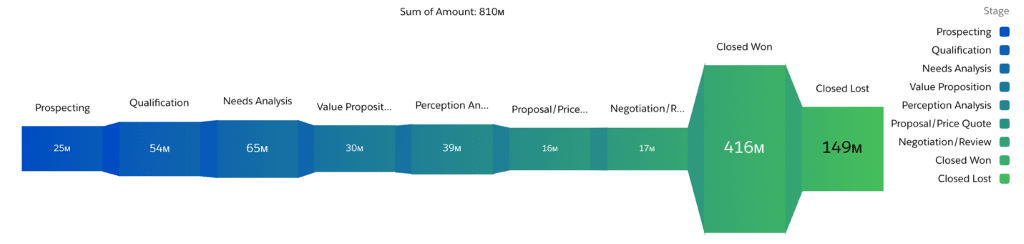
Pipeline Chart
Sales pipeline sorted by Stage Name
Initial SAQL
q = load "opportunities";
q = group q by 'StageName';
q = foreach q generate 'StageName' as 'StageName',
    sum('Amount') as 'sum_Amount';
q = order q by 'StageName' asc;
q = limit q 2000;
Solution Approach
Approach 1: Augment a field within the Opportunity dataset (Tableau CRM) to generate a new column for the Sales stage sequence
This approach would be faster to deliver and has comparatively less change. However, as sales stages are changed/ updated it can result in the Tableau CRM dashboard showing incorrect sales stage sequence. So, it can lead to dual maintenance (Sales cloud and Tableau CRM)
Approach 2: Prefix opportunity stage value with stage position (for e.g. 1 - Prospecting)
This approach may also be a faster change. However, it uses non-friendly sequence numbers in the opportunity stage. Also, if the same stage values are used across multiple sales processes (or record types for other objects), the sequence may not stay correct.
Approach 3: Create a new formula field within the Opportunity object (Sales cloud) to generate a new column for the Sales stage sequence (PREFERRED)
This approach will take more time (depending on your change management processes) but will ensure that Sales teams own and update their sales stages as needed (no dual maintenance between Sales Cloud and Tableau CRM)
However, the given solution works for approaches 1 and 3
Solution Steps
1. Create a new field on Stage Position Opportunity to reflect stage sort value.
2. Update Object connection settings and required workflows/ recipes to get your new column into the desired dataset.
3. Modify Chart SAQL to add a max of Stage Position to result set to get another dimension.
q = load "opportunities";
q = group q by 'StageName';
q = foreach q generate 'StageName' as 'StageName',
    sum('Amount') as 'sum_Amount',
    max('Stage_Position__c') as 'sum_Stage_Position__c';
q = order q by 'StageName' asc;
q = limit q 2000;
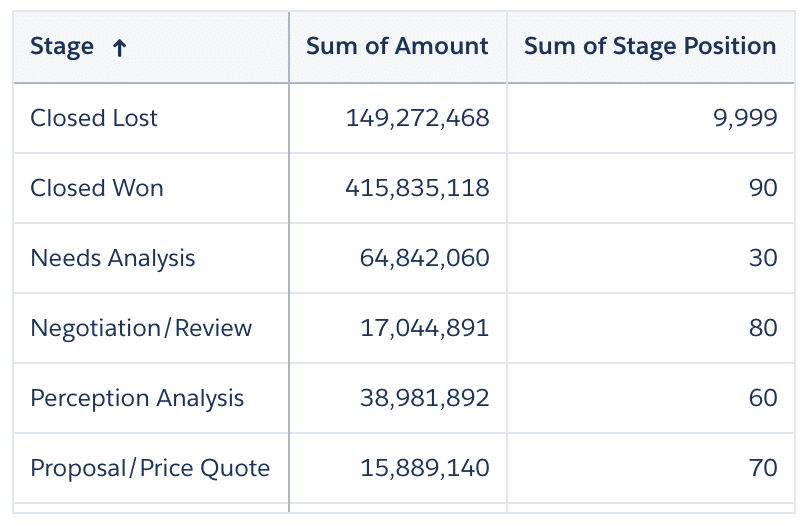
Sample result when you run your query
Pipeline aggregated data; sorted by Stage Name
4. Now, sort final result set using Stage Position field.
Final SAQL
q = load "opportunities";
q = group q by 'StageName';
q = foreach q generate 'StageName' as 'StageName',
    sum('Amount') as 'sum_Amount',
    max('Stage_Position__c') as 'sum_Stage_Position__c';
q = order q by 'sum_Stage_Position__c' asc;
q = limit q 2000;
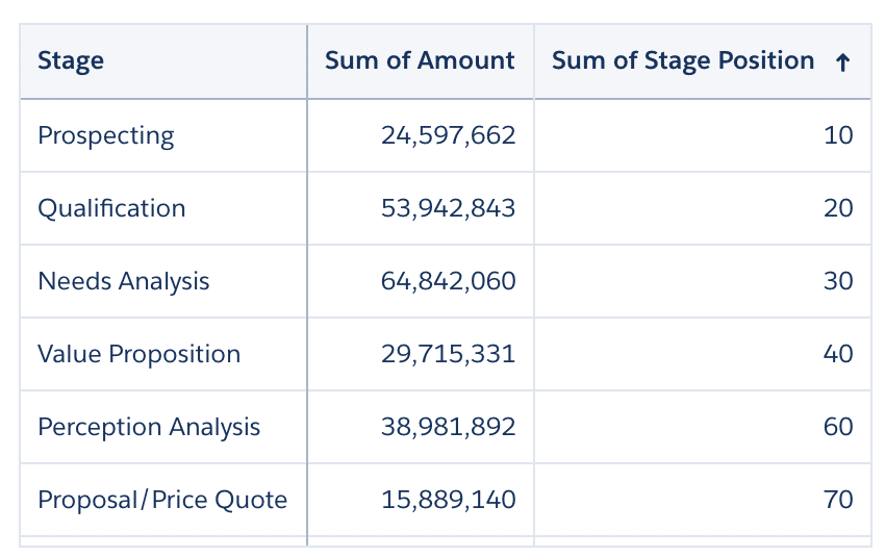
Sample result when you run the query (notice results are sorted by stage position column)
Pipeline aggregated data; sorted by Stage Position
Finally, view your sales pipeline chart sorted in right order
Sorted Sales pipeline
Note
The given solution can work for any similar requirements, wherein sorting needs to be performed via a hidden column, that is, a column not used in chart display.
While working on a recent change with a Tableau CRM sales dashboard, we encountered (a bit late) that the sales pipeline view shows sales stages in the incorrect order. Ideally, you would want the pipeline view to reflect the stage in the same sequence as the sales process (for example Prospect, Propose, Negotiate, Close).
Sales Path
Sales Path
Pipeline Chart
Sales pipeline sorted by Stage Name
Initial SAQL
q = load "opportunities";
q = group q by 'StageName';
q = foreach q generate 'StageName' as 'StageName',
    sum('Amount') as 'sum_Amount';
q = order q by 'StageName' asc;
q = limit q 2000;
Solution Approach
Approach 1: Augment a field within the Opportunity dataset (Tableau CRM) to generate a new column for the Sales stage sequence
This approach would be faster to deliver and has comparatively less change. However, as sales stages are changed/ updated it can result in the Tableau CRM dashboard showing incorrect sales stage sequence. So, it can lead to dual maintenance (Sales cloud and Tableau CRM)
Approach 2: Prefix opportunity stage value with stage position (for e.g. 1 – Prospecting)
This approach may also be a faster change. However, it uses non-friendly sequence numbers in the opportunity stage. Also, if the same stage values are used across multiple sales processes (or record types for other objects), the sequence may not stay correct.
Approach 3: Create a new formula field within the Opportunity object (Sales cloud) to generate a new column for the Sales stage sequence (PREFERRED)
This approach will take more time (depending on your change management processes) but will ensure that Sales teams own and update their sales stages as needed (no dual maintenance between Sales Cloud and Tableau CRM)
However, the given solution works for approaches 1 and 3
Solution Steps
1. Create a new field on Stage Position Opportunity to reflect stage sort value.
2. Update Object connection settings and required workflows/ recipes to get your new column into the desired dataset.
3. Modify Chart SAQL to add a max of Stage Position to result set to get another dimension.
q = load "opportunities";
q = group q by 'StageName';
q = foreach q generate 'StageName' as 'StageName',
    sum('Amount') as 'sum_Amount',
    max('Stage_Position__c') as 'sum_Stage_Position__c';
q = order q by 'StageName' asc;
q = limit q 2000;
Sample result when you run your query
Pipeline aggregated data; sorted by Stage Name
4. Now, sort final result set using Stage Position field.
Final SAQL
q = load "opportunities";
q = group q by 'StageName';
q = foreach q generate 'StageName' as 'StageName',
    sum('Amount') as 'sum_Amount',
    max('Stage_Position__c') as 'sum_Stage_Position__c';
q = order q by 'sum_Stage_Position__c' asc;
q = limit q 2000;
Sample result when you run the query (notice results are sorted by stage position column)
Pipeline aggregated data; sorted by Stage Position
Finally, view your sales pipeline chart sorted in right order
Sorted Sales pipeline
Note
The given solution can work for any similar requirements, wherein sorting needs to be performed via a hidden column, that is, a column not used in chart display.