Case Studies
The client is a reputed licensed manufacturer of Cannabis devices and edible products in the United States of America.

The client required automated data-fetching and individual dashboards for two companies, presenting financial reports with graphical and tabular visualizations from Business Central ERP and LeafLink CRM. Additionally, a consolidated dashboard was required to display data from both companies in a single report for customer convenience. Also, the customer requested the integration of live Business Central data in Power BI for real-time insights and comprehensive business monitoring, which was an important aspect that was lacking.
At the project’s outset, we conducted comprehensive discovery sessions to assess and validate the customer’s requirements. Based on our findings, we proposed implementing Power BI Pro for creating reports and dashboards. We implemented following approaches to fulfil the requirements of the system:

We created various web services in Business Central to supply the relevant data inputs for Power BI.
In power BI we performed the following activities: - Transformed the Business Central data, managed relationships between the different tables, and created multiple custom columns and measures for creating the reports.
We created distinct workspaces for each company in the Power BI service and assigned individual managers to their respective workspaces according to their company. Subsequently, we published the reports on the appropriate Power BI service workspaces for each company.
We implemented scheduled refresh to ensure continuous data updates and real-time information.
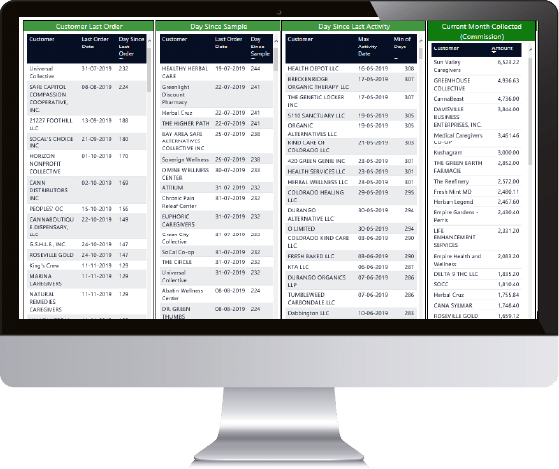
An automated tracking system that allows for easy and easy tracking of sales data such as units, orders, samples, sales by salesperson, items, and regions. Also, customer information tracking, such as last orders, recent activities, sales conversion, and average orders, can also be simplified.
Improved management reporting with graphical and tabular reports, created using Power BI. The system also supports scheduled refresh for continuous access to live data, ensuring that users receive up-to-date information regularly.
Users can easily filter reports using the various slicer options available in the report. Users can furthermore share reports via emails or links. Reports can be exported in PPT and PDF formats or printed.
Assured timely delivery of releases with utmost quality. Provided cost-effective solutions, adhering to schedules, resulting in reduced maintenance costs, reduced manual effort, and quicker report generation.
We're thrilled to hear from you. How can we assist you today?
