Case Studies
The client “Hypertherm” is a part of the Hypertherm Associates family, a 100% employee-owned company composed of the industrial cutting technologies and solutions you know and trust—plasma, waterjet, software, and more—to help their customers succeed like never before. With a consistency of purpose, a drive to innovate, and a passion for customer success, Hypertherm Associates is leading the industrial cutting and shaping industry.

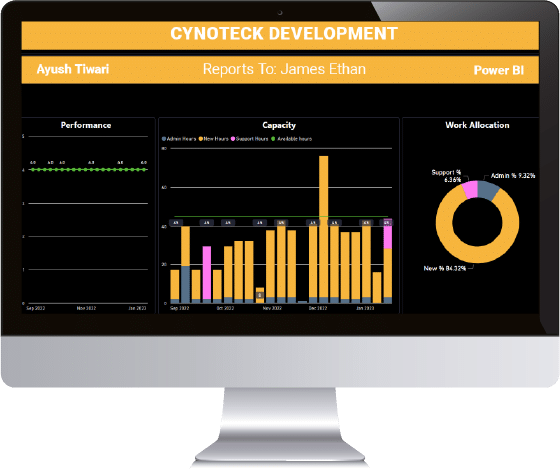
In this Power BI case study, the client required a report to analyze the capacity of outsourced resources and their work allocation within an organization. The objective was to provide insights into resource utilization, identify potential bottlenecks, and ensure efficient allocation of work to the outsourced resources.
We conducted thorough discovery sessions to evaluate and confirm the client’s requirements. The dataset used in this case study includes the following key tables:

Resource Master - This table included the details of all outsourced resources, such as resource ID, name, department, and contact information.
Resource Capacity - This table tracked the capacity of each resource, including the number of hours available per week and the start and end dates of their contract.
Work Allocation - This table incorporated information about the tasks assigned to each resource, including the task ID, task name, start date, end date, and the number of hours allocated to each task.
Resource Capacity Planning - Implemented a drill-through feature to enable users to click on a specific resource to view more detailed information about their capacity and allocated tasks.
Developed a comprehensive Power BI report to analyze the capacity of outsourced resources and their work allocation.
This report provided valuable insights into resource utilization, task allocation, and performance, enabling stakeholders to make informed decisions and optimize resource management within the organization.
The report's interactivity and data visualization best practices made it a powerful tool for resource planning and analysis.
This report can be shared with relevant stakeholders to collaborate with them and gather feedback while identifying areas for improvement.
We're thrilled to hear from you. How can we assist you today?
