Case Studies
The client, a prominent retail organization operating globally, required a comprehensive report based on the Global Superstore Dataset. This dataset included historical sales and customer information for various stores across different regions. The primary objective was to analyze and provide insights into the company’s performance, identify areas of improvement, and make data-driven business decisions. The client emphasizes the need for clear, actionable recommendations to enhance efficiency and profitability.
The client, a prominent retail organization operating globally, required a comprehensive report based on the Global Superstore Dataset. This dataset included historical sales and customer information for various stores across different regions. The primary objective was to analyze and provide insights into the company’s performance, identify areas of improvement, and make data-driven business decisions. The client emphasizes the need for clear, actionable recommendations to enhance efficiency and profitability.
Cynoteck provided actionable recommendations and solutions to improve overall efficiency and profitability.
The sales analysis focused on the specified timeframe which included overall sales trends, including yearly, quarterly, and monthly data. Comparing sales performance across regions and countries, a seasonal sales pattern was also examined.
Provided tailored marketing strategy recommendations based on customer segmentation analysis to gain insights into distinct customer groups served by the company.
Evaluated the inventory turnover rate and identified any inventory management issues or inefficiencies while providing relevant suggestions.
An analysis of profitability across product categories and regions was conducted. Additionally, supply chain processes were examined to identify potential bottlenecks and inefficiencies. The supply chain was optimized, resulting in improved order processing and delivery times.
This included data source and structure, data cleaning and handling missing values, and identifying outliers & dealing with them appropriately.
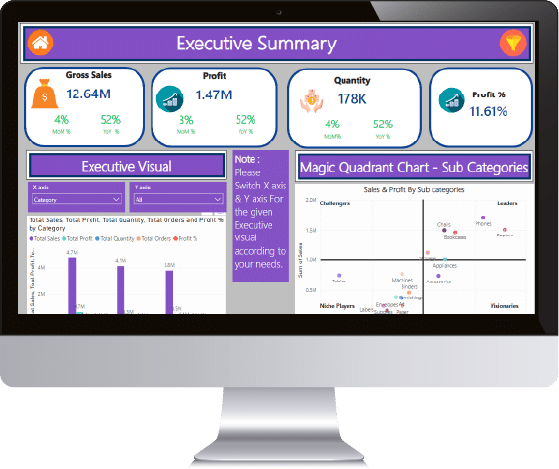
This illustrated summary statistics of key variables such as sales, profit, and quantity and visualization of data distribution to gain insights into sales patterns.
Analysis of sales and profit comparison across different regions and countries, identification of high-performing and low-performing regions, and market share analysis in each region.
Analysis of sales performance for various product categories, identification of popular product categories and their profitability, and seasonal trends in product demand.
Segmentation of customers based on purchase behavior. Profiling high-value customers and potential areas for customer retention. And recommendations for targeted marketing strategies.
Analysis of sales and profit trends over time. Identifying seasonal patterns and cyclical fluctuations and forecasting future sales based on historical data.
Analysis of inventory turnover and stockouts. Recommendations for optimizing inventory levels and supply chain efficiency.
Sentiment analysis of customer feedback. Addressing common customer complaints and improving overall satisfaction.


We're thrilled to hear from you. How can we assist you today?