Everything you need to know about Microsoft Power BI

In this blog, we will discuss everything that you need to know about Power BI. In today’s fast-paced world, we all understand the importance of data analysis for any business, to explore and filter it in a meaningful way. Moreover, Data analysis is important for many different reasons, like:
To know your target customers,
To know the future trends in consumer behavior,
To effectively run your business by reducing operational and production costs
To make an informed decision that can help transform your business
To create better and effective strategies for sales and marketing.
Gartner has recognized Microsoft as a Magic Quadrant Leader in analytics and business intelligence platforms for 13 consecutive years.
Power BI is a powerful business intelligence and Data Visualization tool by Microsoft of the Power Platform family. In addition to Power BI, other components of Microsoft Power Platform are Power Apps, Power Automate, and Power Virtual Agents.
Power BI is a collection of cloud-based services, apps, and connectors that work together to manage and analyze data from various data sources.
Power BI is a great analytical tool that lets you dive deeper into your data by slicing, filtering, and drilling down to get insights hidden in your data. It is a unified, user-friendly, and scalable platform that can visualize any data to get insights for self-service and enterprise business intelligence.
Power BI lets you analyze data and drive your business outcome in a visually immersive and interactive way with graphs and charts. It lets you share and publish relevant data through reports and dashboards with anyone or everyone you want.
As with all other Power Platform components, Power BI provides seamless integration to various cloud-based or on-premises data sources and more than a hundred other underlying data platforms using a library of connectors.
Power BI features several elements that all work together and you can plan to choose any as per your budget, requirement, or that fits your role most effectively.
Let’s have a quick overview of the different elements of Power BI
It is a free application that you can download and install on your local computer. It connects to different data sources and combines them to create a data model.
This data model helps you to create interactive and impressive visuals that you can share as dashboards and reports within your website, Teams, SharePoint, and many other apps within your organization.
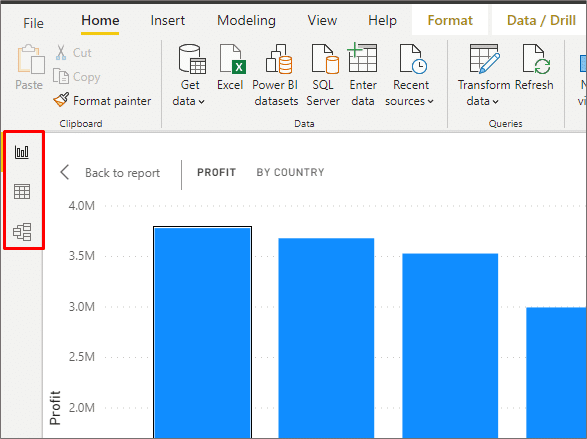
Available views in Power BI Desktop are:
Report
Data
Model
It is a Software as a Service (SaaS) part of Power BI. It is sometimes also referred to as Power BI online.
Once you build a report in Power BI Desktop, you can publish it on the Power BI service, for the end-users to view the information and act upon it.
You can also straight away create reports in the Power BI service and publish it for the end users to view and interact with them.
Power BI offers a set of mobile apps for Android, iOS, and Windows 10 devices. In addition, all the reports and dashboards that you create on Power BI Desktop or Power BI service are available in the Power BI mobile apps. Mobile apps enable users to get secure access to real-time dashboards and reports.
It is used to author paginated reports that you create with your data and then publish them in the Power BI Service to share them with everyone.
It provides data visualizations that include maps, charts, gauges, sparklines, indicators, and data bars to provide new insights that cannot be achieved with standard charts and tables.
You can create reports from a variety of data sources like SQL Server and Analysis Services, Oracle, Power BI datasets, and other databases.
It is an on-premises reporting solution to give your users access to rich, interactive reports and the capabilities of SQL Server reporting services.
As it is included in the Power BI premium, it gives you the flexibility to create reports on Power BI Desktop and move it to the cloud whenever there is a requirement.
Users can view and access all the reports and KPIs in a secure web portal of the Power BI Report server. Power BI Report Server is available through two different licenses: Power BI Premium and SQL Server Enterprise Edition with Software Assurance.
The major building blocks of Power BI are:
Visualizations
Datasets
Reports
Dashboards
All are created on capacities and organized into workspaces.
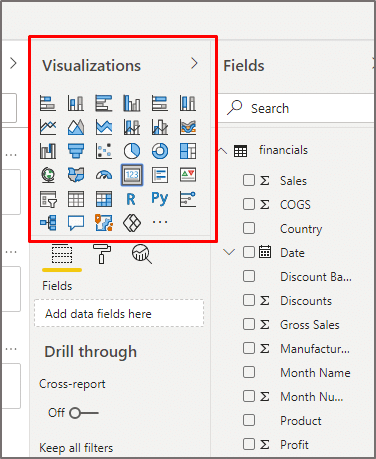
Visualization helps to turn the granular and complex data into interactive, useful, easily understood, and visually compelling business information. For instance, it brings your data to life through interactive reports, charts, graphs, and other visual representation and gives powerful business insights effectively and quickly.
The different types of visualizations that can be added to Power BI are:
Area charts (Layered and Stacked)
Bar and column charts
Cards: Single number
Cards: Multi row
Combo charts
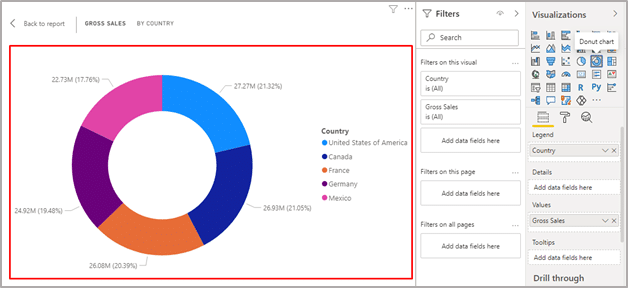
Doughnut charts
Funnel charts
Gauge charts
Key influencers chart
KPIs
Line charts
Maps: – Basic maps, ArcGIS maps, filled maps, Shape maps
Matrix
Pie charts
Power Apps visual
Q&A visual
R script visual
Ribbon chart
Scatter and bubble charts
Scatter-high density
Slicers
Treemaps
Waterfall Charts
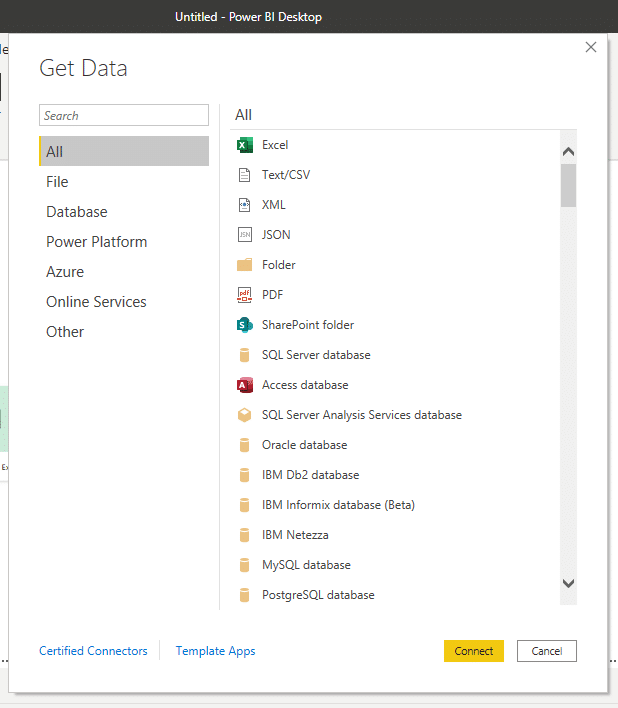
Dataset is a collection of data that is used for visual representation of data in Power BI. It is automatically created when you use Get Data in Power BI to connect or import data to create visuals, dashboards, or reports in Power BI.
It is possible to connect to and import data from different data sources, like a content pack, a file, or even a live data source. A dataset contains all the information about the data source and the data source credentials.
A dataset can represent a connection to models developed in Power BI Desktop and also to a live connection by external-hosted Analysis models like SQL Server Analysis Services and Azure Analysis Services.
A Power BI report represents a multi-perspective view into a dataset through visuals. A report can have a single visual or pages full of visuals. It helps you to find insights from the datasets. Reports in Power BI are based on a single dataset.
The visuals shown in the Power BI reports are not static, and they change as the underlying data is updated. A report is highly customizable and highly interactive.
Moreover, it gives you the freedom to explore your content by slicing, filtering, and highlighting your visuals without modifying the underlying datasets or the original shared content.
Unlike reports that can show visuals on a single page or multiple pages, a dashboard is restricted to only one page. It is also often called a canvas. However, it is a feature exclusive to the Power BI service only.
Dashboard is not available on Power BI Desktop. The visualizations shown on the dashboard are called tiles. The visualization represented on the dashboard comes from the report, and each report is based on a dataset.
The visualization on a dashboard can come from a single underlying report or many, and from one underlying dataset or many. Dashboard is a great way to give a quick glance at all your important metrics and monitor your business.
Power BI comes with three pricing plans – Desktop, Pro, and Premium. The Power BI Desktop is free to use and can be downloaded and installed on a local computer. Using Power BI Desktop, you can create reports, model, and data visualization.
Power BI Pro costs $9.99 monthly per user, which includes building dashboard, data governance, data collaboration, also the ability to publish reports anywhere. Power BI Premium is priced at $4,995 monthly and provides dedicated cloud compute and storage resources.
However, the Premium plan allows any user to consume Power BI content with advanced administration and deployment controls.
1. Seamless Integration with the existing applications
Power BI is a great analytical tool that integrates seamlessly with your existing applications to analyze and share insights from data.
2. Customizable and interactive dashboards
Power BI lets you create an interactive and stunning dashboard that can be customized as per your business requirement.
3. Cost-effective
Power BI Desktop is free of cost, and you can start creating report to analyze with different visualization by connecting to different data sources.
4. Robotic security
As with all other Microsoft products, Power BI is very safe to use. As it is built on Azure, which is a cloud computing infrastructure and platform by Microsoft. Power BI service uses Azure Active Directory (AAD) for the authentication of users.
5. Easy to use
Power BI is a low-code analytical tool. You can create stunning visuals, analyze data, and share insights without any experience in coding. Above all, being a low-code platform, it empowers everyone to build dashboards and create reports using different visualizations.
Thus, all-in-all Power BI is a great tool when you need to drive outcome for your business based on your data with less effort.
I hope you enjoy reading the post.
Cynoteck is a Microsoft Gold Partner and Power Platform Partner. With our knowledge across the Microsoft Stack, we build solutions that best fit your needs. We help you identify and utilize your organizational data to the best, which lets you make intelligent decisions for your growth.
Connect with our team if you are interested in implementing Power Platform in your business.
Power BI is a powerful tool, allowing industries to turn raw data into interactive and clear insights. Let us discuss some common uses of the Power BI solution:
Data Visualization: Organizations can create dashboards, charts, and graphs to make complex data easy to understand. It also helps decision makers to spot patterns and trends quickly.
Business Reporting: Moreover, industries can build interactive reports that they can share with their teams. Professionals can easily track KPIs, financial results, or sales performance in real time.
Data Insights & Analysis: Power BI comes with powerful tools, like DAX and AI-driven features, helping businesses to get deeper results and make smarter results effectively.
Real-time Monitoring: Apart from this, the Power BI solution helps to connect real-time streams, such as inventory, sales, or customer service metrics, for live updates.
Collaboration & Integration: Organizations can integrate Power BI with Microsoft Tools, including SharePoint, Excel, Dynamics 365, and Teams. Moreover, it also helps businesses to collaborate seamlessly and work together in real time.
Industry-Specific Solutions: Power BI solutions can be implemented across multiple industries, including Healthcare, Retail, Finance, Manufacturing, etc. Industries can use this tool to monitor sales, track data, analyze risk, and reduce downtime.
There are more uses of the Power BI platform, helping businesses to simplify their complex tasks and get measurable ROI.
This blog has shared a complete overview of the Power BI platform, such as its components, key features, uses, and more. It serves various industries with advanced capabilities to make their workflow faster and smarter.
Power BI is offered by Microsoft, allowing organizations to collaborate and integrate seamlessly to work efficiently. It also offers flexibility, scalability and security to support industry-specific needs.
If you are looking to make your business workflow easier, faster, and secure, contact Cynoteck today and implement Power Platform in your business.
Implement Power BI with expert guidance and transform raw numbers into real business insights
Get a Power BI ConsultationQ1. Is Power BI free to use?
Yes, Power BI Desktop is free to use for building reports, getting deeper insights, or creating dashboards. However, if you need to collaborate or share features, you require a Power BI Pro or Premium license.
Q2. What is the difference between Power BI Pro and Premium?
Power BI Pro: It is ideal for small to medium teams, comes with per per-user license, and allows creating, sharing, and collaborating.
Power BI Premium: It is an enterprise-level license with larger dataset support, dedicated capacity, and advanced features like paginated reports and AI.
Q3. Can Power BI connect to Excel and SQL databases?
Yes, you can easily connect Power BI to Excel, cloud databases, SQL Server, and other sources through built-in connectors.
Q4. Do I need coding skills to use Power BI?
No, you do not require any coding skills to use Power BI. However, you need to learn DAX (Data Analysis Expressions) and some basic queries to unlock advanced analytics.
Q5. Is Power BI good for large organizations?
Yes, Power BI Premium is good for large organizations to handle larger volumes of data, ensure high performance, and apply governance policies.

Today, entertainment has taken new forms digitally, changing how we make and share content. The media and entertainment industries are among the early adopters of digital technology. Their future in this area is bright since AI tops the list of growing innovations
 Need Strategic Partners for Scalable Product Development C.webp)
Discover how strategic partnerships help Independent Software Vendors (ISVs) overcome challenges in product development, accelerate time-to-market, and scale with specialized expertise.
We are more than just developers and consultants—we are your partners in navigating the digital landscape. Let us be the engine behind your next big success while you focus on your core vision.
Explore Opportunities!