
Microsoft Dynamics 365 provides numerous advantages to business owners who want to scale their business, enhance the quality of service provided, and optimizing business transactions. Microsoft Dynamics 365 for business is designed to augment decision-making processes and enhanced teamwork. One of the most popular advantages provided by Dynamics 365 is the reporting tools.
Dynamics provides numerous tools and modules that make reporting smart, standardized, and comprehensive. Businesses that leverage enhanced reporting opportunities found on Dynamics can monitor Dynamics 365 reports the progress of campaigns and projects, track sales and purchases, augment teamwork, and detect areas for improvement. All the reporting tools available on Dynamics 365 are fully and easily customizable.
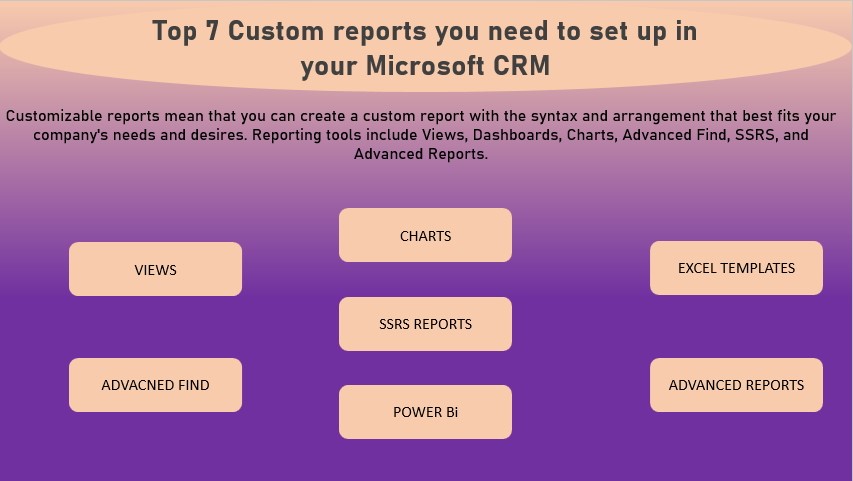
Customizable reports mean that you can create a custom report with the syntax and arrangement that best fits your company’s needs and desires. Reporting tools include Views, Dashboards, Charts, Advanced Find, SSRS, and Advanced Reports.
Each type of customizable report is listed according to the complexity and skill required to set it up. As you go higher, each report provides greater capabilities in task automation, computation, data management, and visualization.
Also, read: Microsoft Dynamics vs QuickBooks: Know what’s right for you
Customizable report tools might be the best thing that ever happened to Dynamics 365.
Top 7 Custom Reports you Need to Set up in Your Microsoft Dynamics 365 CRM
1. Views
Views are popular for the ease in setting up, it is the simplest among the lot. Customizing a Views report allows you to decide the fields you want to see. By combining Views with advanced find, you get to create complex custom queries and search options.
Creating custom Views will let you properly utilize company records to develop comprehensive reports. Customizing the fields that are visible is a subtle way to ensure security.
Views allow you to easily create custom reports based on the type of audience and their security level. For example, you can display the inventory locations owned by the company, their address, and estimated threat levels, when reporting to management or security teams.
When reporting to the public, these security data can be omitted. Data from Views can be formatted and distributed to Excel.
Also, read: Adobe Sign for Microsoft Dynamics 365 CRM integration Guide
2. Charts
Charts provide an excellent way to present reports using creative graphics and diagrams. The designs and beauty available on Charts are much better than anything found on Views. Charts give you access to different kinds of graphs, including bars, pies, funnel, line, and area graphs. This tool automatically aggregates your data providing descriptive analysis to your data.
Charts also provide the filter option allowing users to decide which information to display. The drill-down option also allows users to ignore unwanted data and focus on the underlying factors and elements that are being reported.
A use case for the drill-down option, imagine a pie chart that shows the ratio of a company’s annual expenditure. Touching the largest expenditure will show more details such as time of expenditure and percentage contribution of constituent purchases.
3. Excel Templates
Everyone is conversant with Excel. Excel business package provides a spreadsheet background for computing and analyzing data. Excel package is very popular with financial and reporting teams. Access to Formulas, Pivot Tables, and smart graphs.
Excel Templates creates a system that is easier to adapt due to their similarities to the Excel platform. On Excel Template, you can create Excel files. On this file, you have access to all the traditional Excel tools and features including formulas for complex calculations, Pivot Tables, charts for graphic displays.
Excel Template allows you to export data with formulas, smart tables, and creative graphs.
4. SSRS Reports
SSRS reports provide something that is missing or limited in the previously listed reporting tools. Data retrieval, advanced searches, report summarization, and formatting are some features available on SSRS reports only.
SSRS stands for SQL Server Reporting Services, and this reporting tool overcomes all the limitations that are found on Views, Charts, Advanced Find, and Excel Template.
SSRS provides unique tools to create basic custom reports. You can run custom reports on SSRS, provide all the features and functionality that give reports more computational and search power. The base codes used to build and execute SSRS reports are called Scripts.
SSRS reports require special programming skills to build them. Dynamics SSRS reports enabling users to generate reports with multiple record types simultaneously.
SSRS reports can also calculate complex functions, use charts to visualize data, format fonts, designs, colors, and tables. With multiple record types, you can create a highly complex and varied report using multiple records to create the desired effect.
Also, read: Which Microsoft Dynamics 365 Solution will Best Serve Your Business?
5. Advanced Find
An advanced Find is a powerful tool for data management and enhanced search queries. Advanced Find can be linked with other reporting tools to create awesome custom reports with enhanced data control. Advanced Find allows you to link data on reports to other similar or related data.
What’s a comprehensive database when you have trouble finding what you need? Advanced Find makes sure you do not miss anything when creating your reports.
An example would be creating a tool that can track expenses based on the groups that spend it, then link expenditure with a budget and productive performance rating.
6. PowerBI
PowerBI is another powerful package designed for businesses. PowerBI provides innovative communication and data analysis features that will enhance the reporting and planning power of any management team.
PowerBI leverages the strongest feature available of Dynamics 365, which is integration. Integrating Dynamics 365 and PowerBI makes all the computational and data transfer capabilities on PowerBI available on Dynamics 365 reports.
PowerBI also enables Dynamics to access its database along with information banks available on other third-party applications. What’s even more exciting is that you can access PowerBI dashboards into Dynamics display for quick access.
With access to multiple information sources, your report would get more comprehensive and accurate. PowerBI is highly customizable and requires little to no technical knowledge to operate and build custom reports.
Also, read: Top ERP implementation mistakes to avoid (learn from these failures)
7. Advanced Reports
Advanced reports are much more complex than all the previous custom reporting options. Advanced reports may be required when complex computations, multiple data set queries, accessing multiple databases, and organizing large data based on conditional rules. As expected, Advanced Report requires more technical skills to build and customize than all the previous tools.
Once set up, Advanced reports can automatically compile data from different computers and databases available on a server. Advanced reports use filtered Views combined with security credentials to ensure that information on a network is not mismanaged.
There are different tools you can use to build an Advanced report, including Business Intelligence Development Studio (BIDS), Report Builder, FetchXML queries using SQL Server Data Tools, and Report Wizard.
Conclusion
In wrapping up our journey through the top seven custom reports essential for your Dynamics 365 CRM, it’s evident that these reporting powerhouses hold the key to unlocking invaluable insights and enhancing your business operations. Each report, meticulously designed to cater to specific needs, offers a window into diverse aspects of your business, fostering informed decision-making and strategic planning.
Remember, the magic doesn’t just lie in setting up these reports; it’s in how you wield their potential. Tailor them to suit your unique business landscape, leveraging the data they yield to optimize processes, identify trends, and drive growth.
Your customer-centric approach, sales performance, marketing initiatives, and overall operational efficiency will all benefit from these customized reporting tools. With these reports at your disposal, you’re not just keeping track; you’re gaining a competitive edge, streamlining your workflows, and steering your business toward greater success.
So, take the insights gleaned from these reports, adapt them to your business’s rhythm, and watch as they pave the way for smarter strategies, elevated customer experiences, and a more robust, thriving enterprise. Cheers to empowering your Dynamics 365 CRM with these game-changing reporting assets!

Microsoft Dynamics 365 Consulting
Cynoteck Technology is a leading expert on Microsoft Dynamics 365 and we provide an array of Dynamics 365 Consulting Services to all size of businesses. Get in touch with us for latest updates on Dynamics 365.
